7. Data and conditional formatting
Left panel → Data (or the palette, Shape data: open the panel).
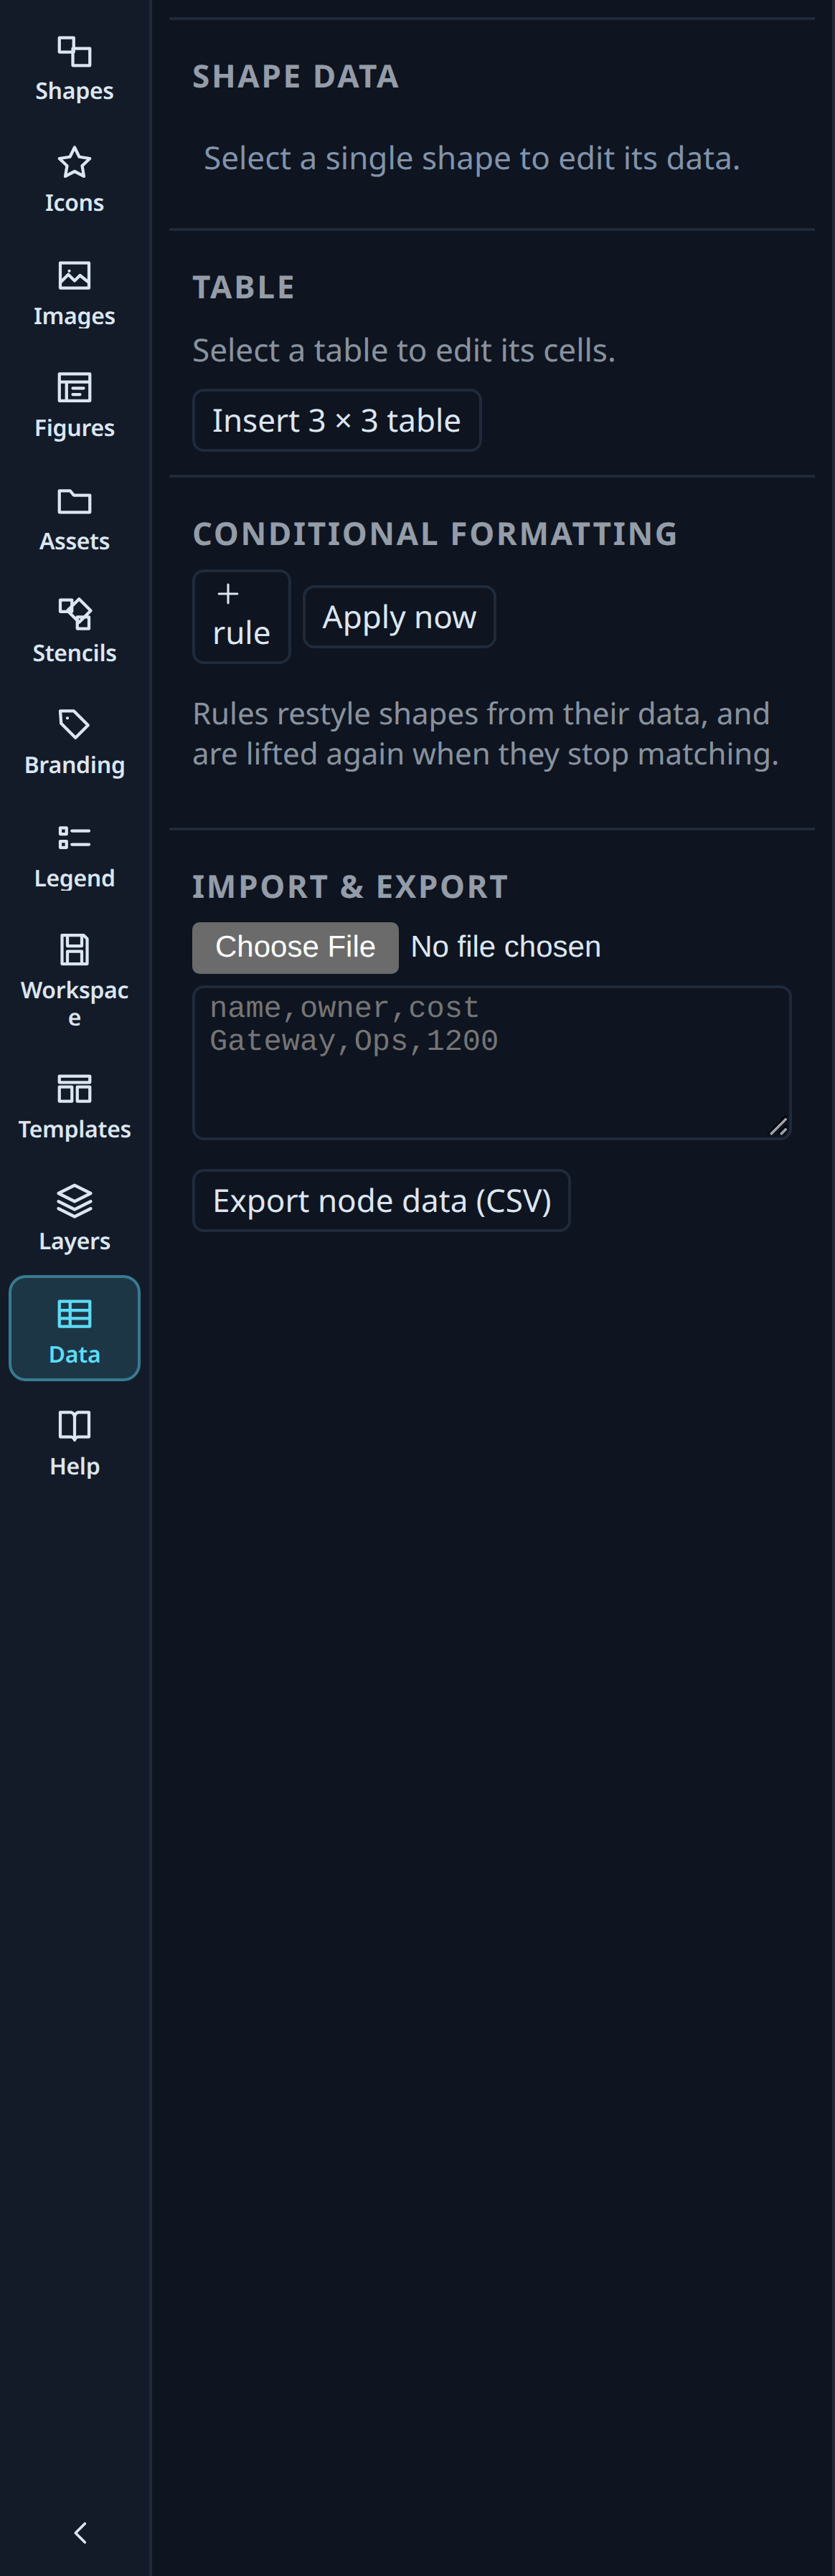
Shape data#
Any node can carry typed key/value properties. Types are string, number,
boolean, date and url. Add, rename, retype and delete them in
Data ▸ Shape data with one node selected.
One property can be nominated as the badge: its value is then drawn as a small chip on the shape itself.
Shape data is stored under the node's meta.data, travels with copy/paste and
JSON export, and is visible to the AI layer and to the MCP server
(get_node_data / set_node_data).
Tables#
Data ▸ Table edits the selected table node: header row, cell values, add and
remove rows and columns (also on the right-click menu and in the palette under
Table). The canvas overlay lets you drag column widths directly.
Conditional formatting#
Data ▸ Conditional formatting holds a list of rules, evaluated in order:
if <property> <operator> <value> then <style>
Operators: equals, is not, >, ≥, <, ≤, contains, starts with,
ends with, is empty, is not empty, is true, is false, is before,
is after — the comparison ones are offered only for the types they suit.
Rules are re-evaluated when you edit shape data, edit a rule, or run
Apply conditional formatting from the palette.
Manual overrides are never clobbered irreversibly. Whatever a rule wrote last time is recorded on the node; re-applying first lifts exactly those values, and only the ones you have not since changed by hand. Change a fill manually afterwards and the rule leaves it alone; delete the rule and the shape goes back to what it was.
CSV and JSON in#
Data ▸ Import & export turns a table of records into shapes.
- Paste or choose a CSV/JSON file. The delimiter is sniffed (comma, semicolon, tab or pipe); quoted fields, embedded newlines, CRLF, a BOM and ragged rows are all handled.
- Map columns to
id,text,body,kind,styleandparent— or, in edge mode, tofrom,toandlabel. - Pick a layout:
grid,treeorrows. - The panel previews exactly what will be inserted; inserting is one undo step.
Unmapped columns become shape data on the node they came from, with their type guessed.
CSV out#
Palette → Export node data as CSV writes one row per node —
id, kind, text, body, x, y, w, h, parent followed by one column per
shape-data key found anywhere in the document — so a diagram can go out to a
spreadsheet and come back.