13. Mermaid diagrams
Plota reads Mermaid source and turns it into a normal, editable drawing: real shapes, real connectors, frames for subgraphs. Once it is on the canvas it is yours to move, restyle and export like anything you drew by hand.
Bringing Mermaid in#
Any of these work, and all of them read the same way:
- Paste — copy the Mermaid text (with or without a
```mermaidfence) and pressCtrl/⌘ Von the canvas. A paste merges into the current page. - Import —
Import Diagramin the toolbar (Ctrl/⌘ O) and choose an.mmd/.mermaidfile, or drop the file onto the canvas. Import asks whether to add the drawing to this page or open it as a new document.
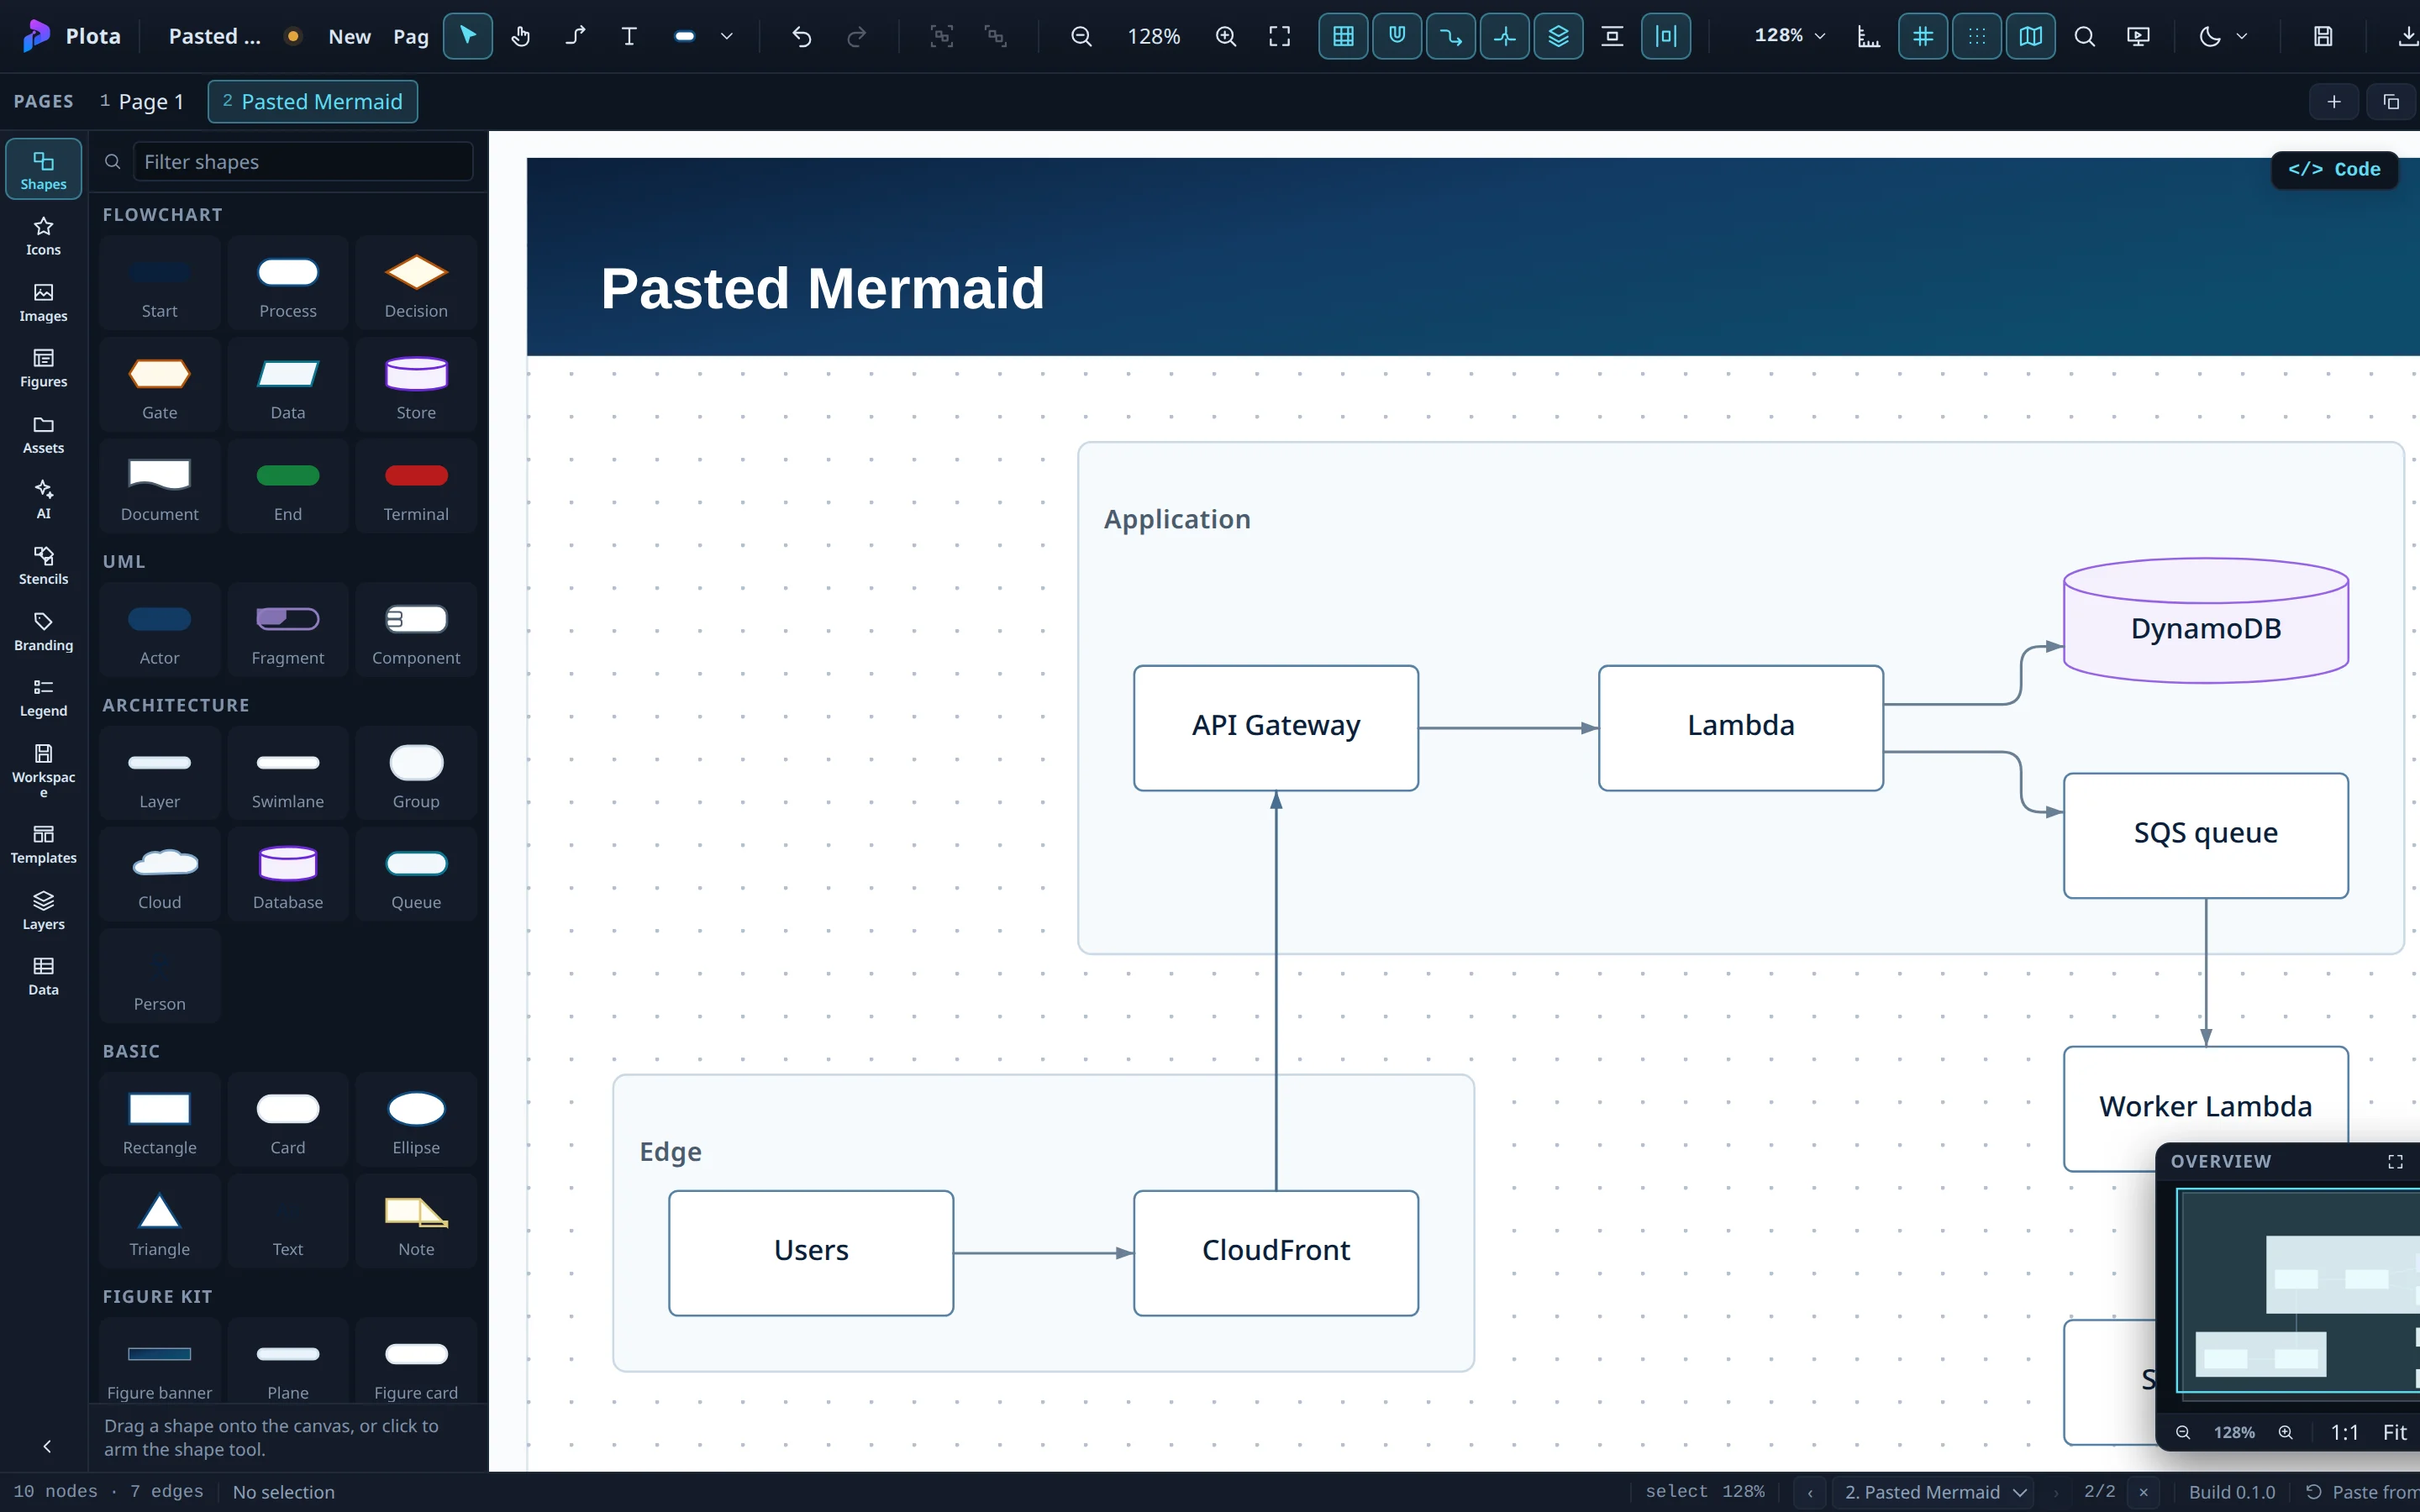
The title in the front matter (title:) names the page, and the direction you
wrote (flowchart LR, TD, …) is kept when you later run Tidy.
If something in the source could not be drawn exactly, the import summary says what and why — an unknown shape word, for example, becomes a process box and is named in the warning rather than passing silently.
The 13 supported types#
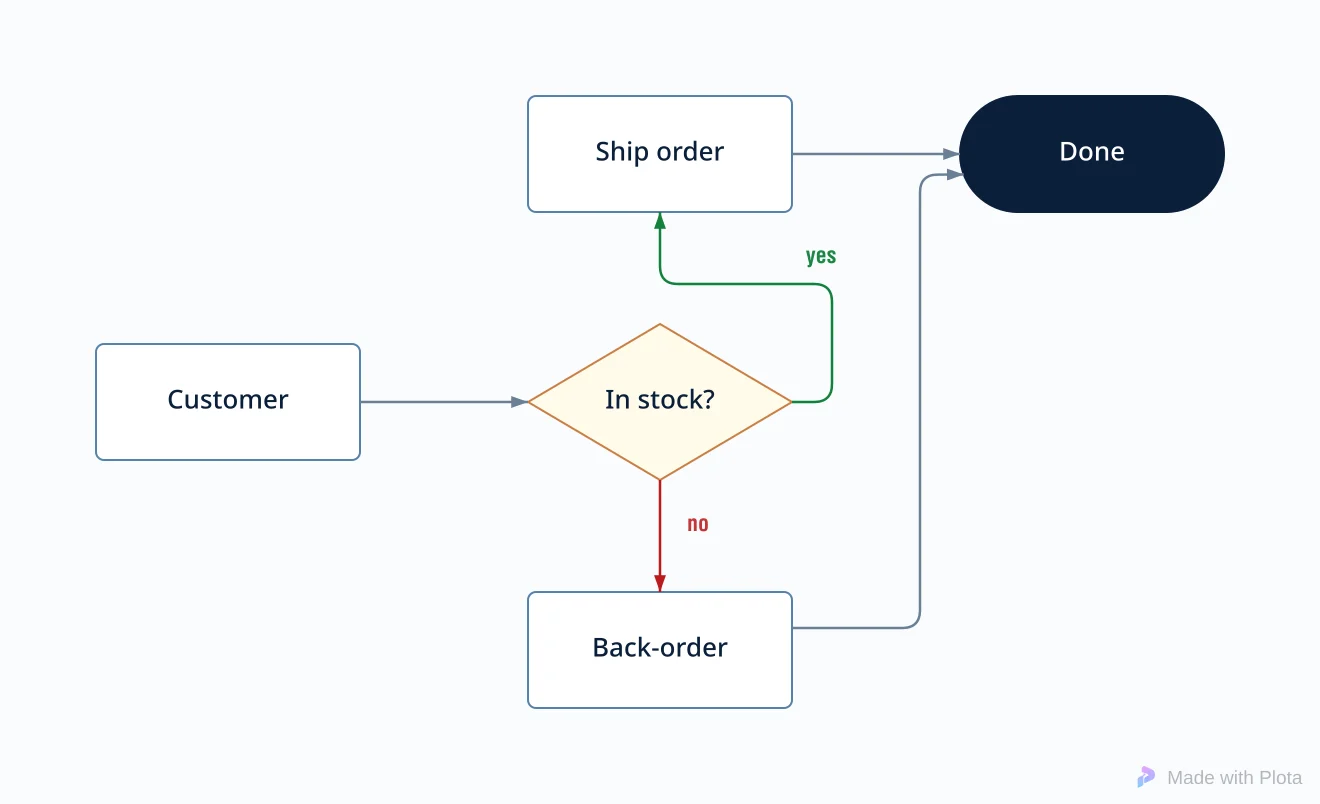
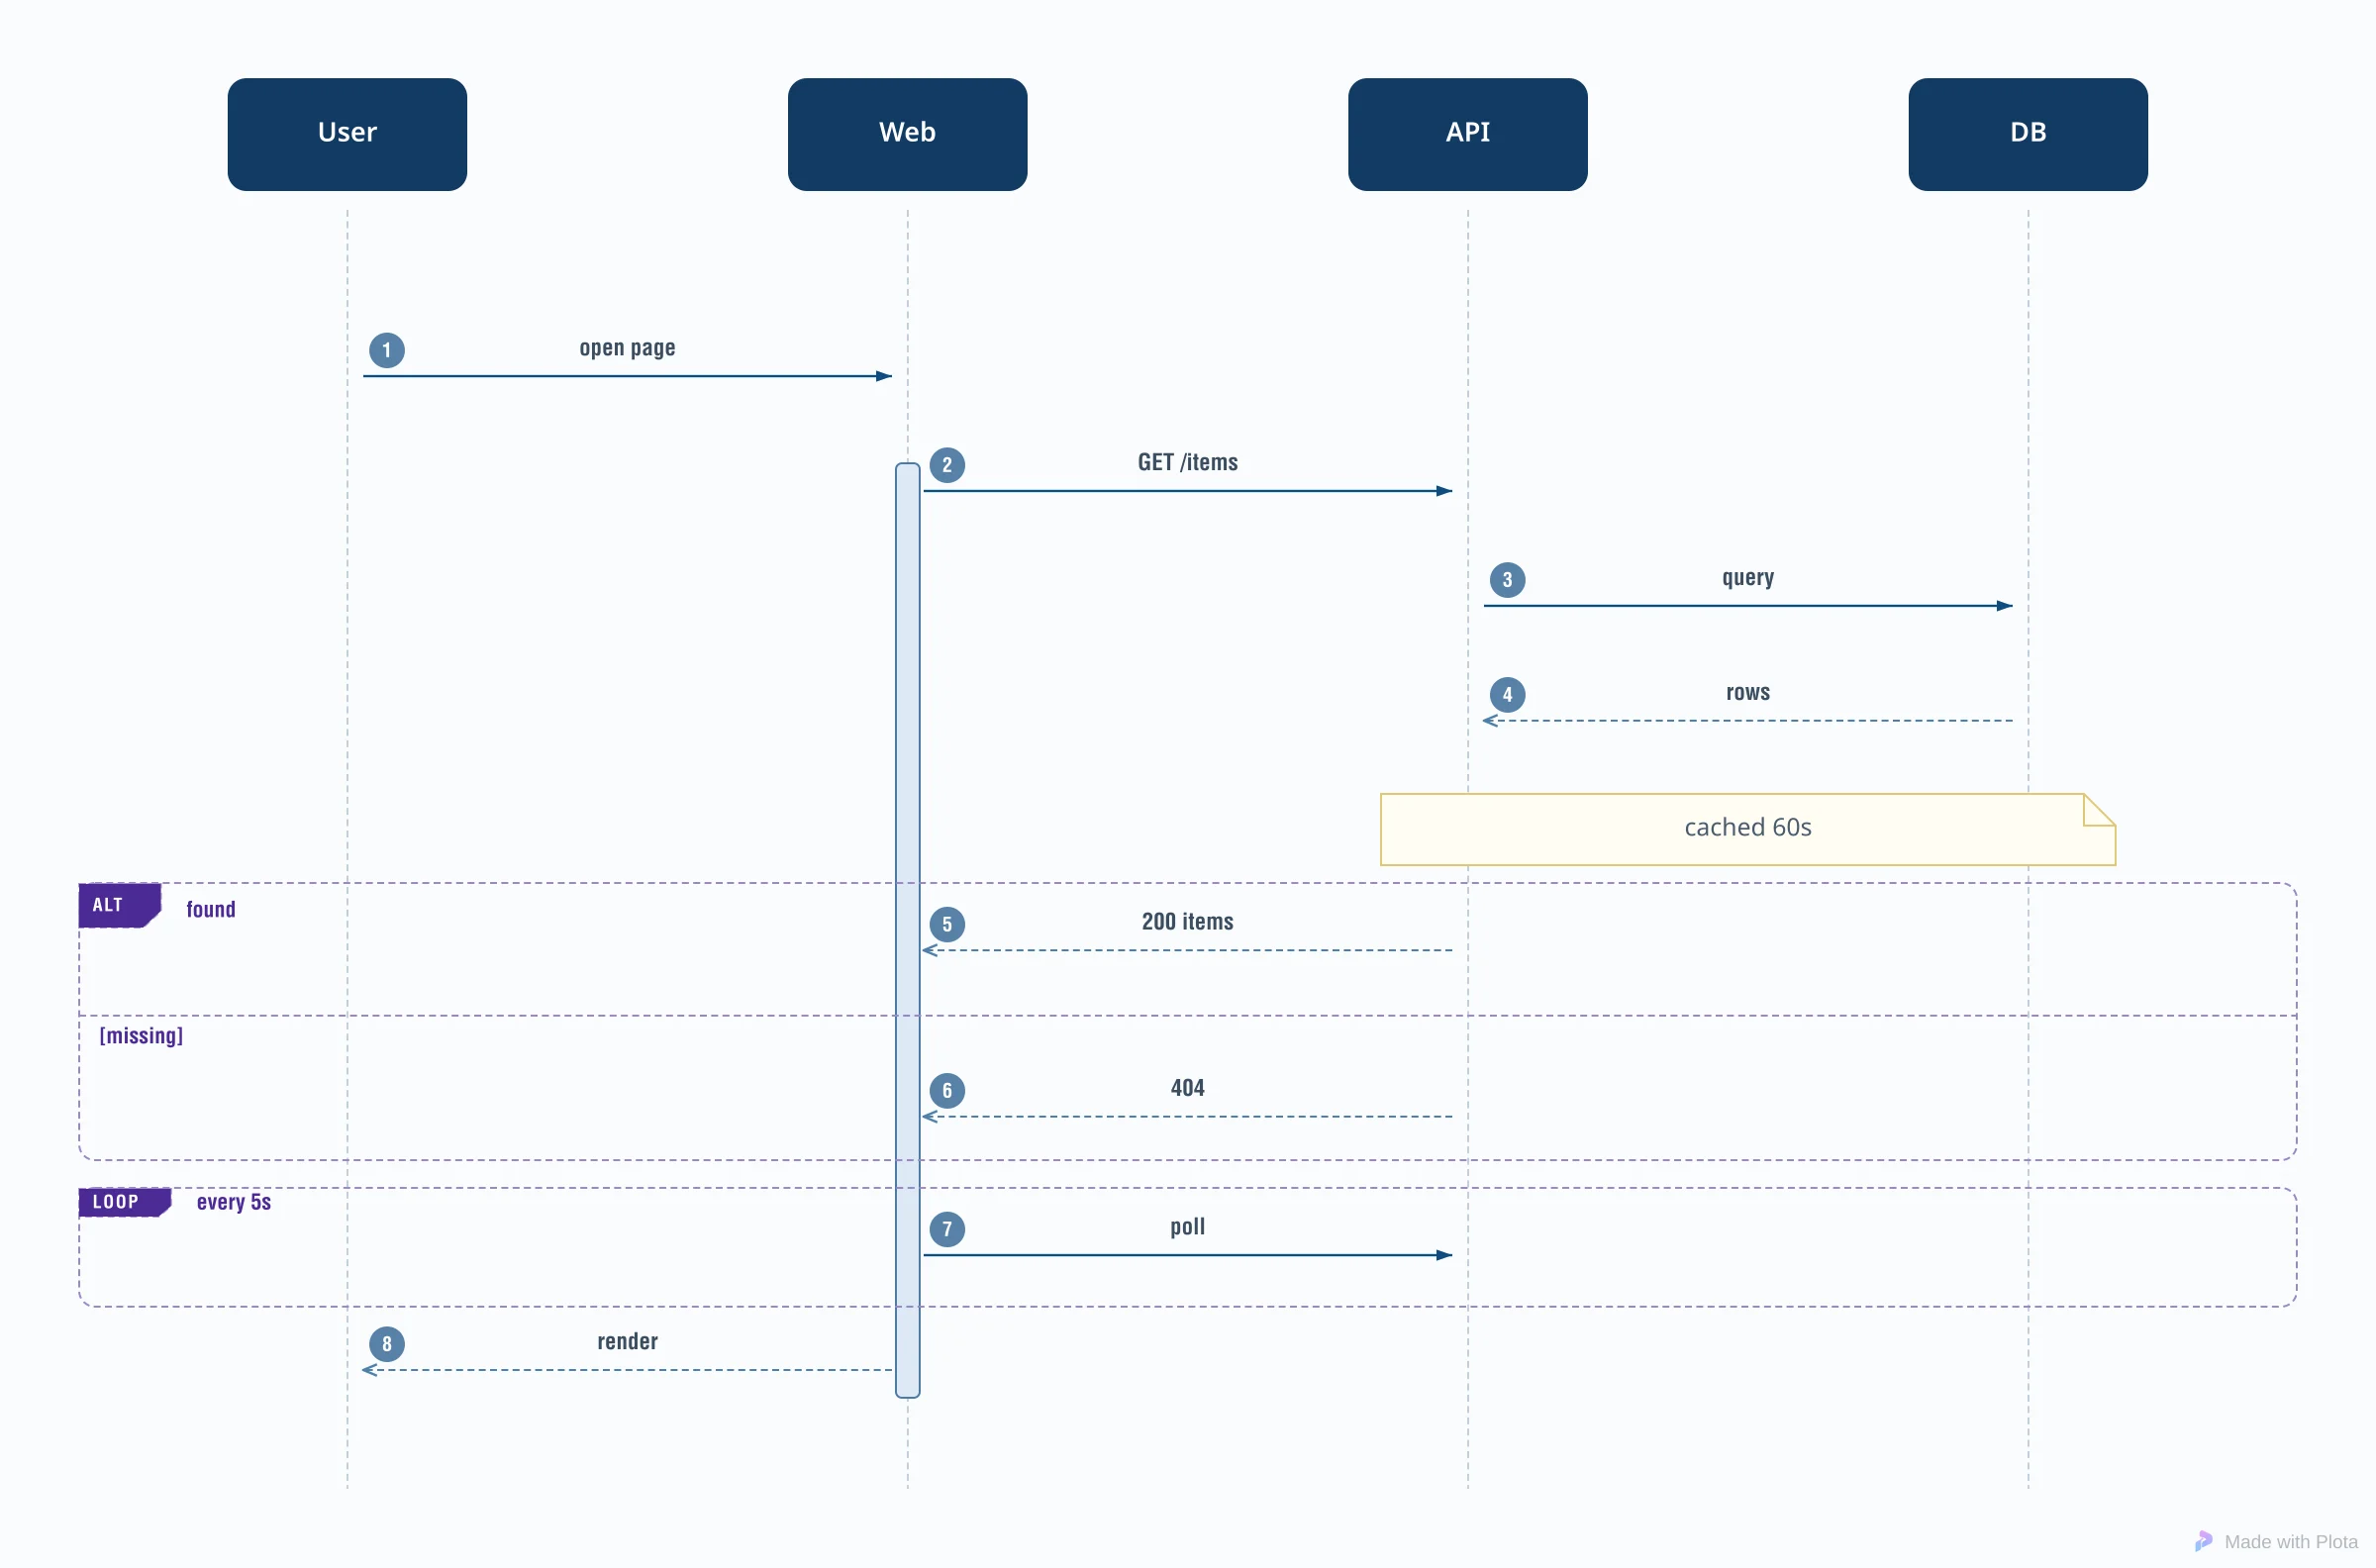
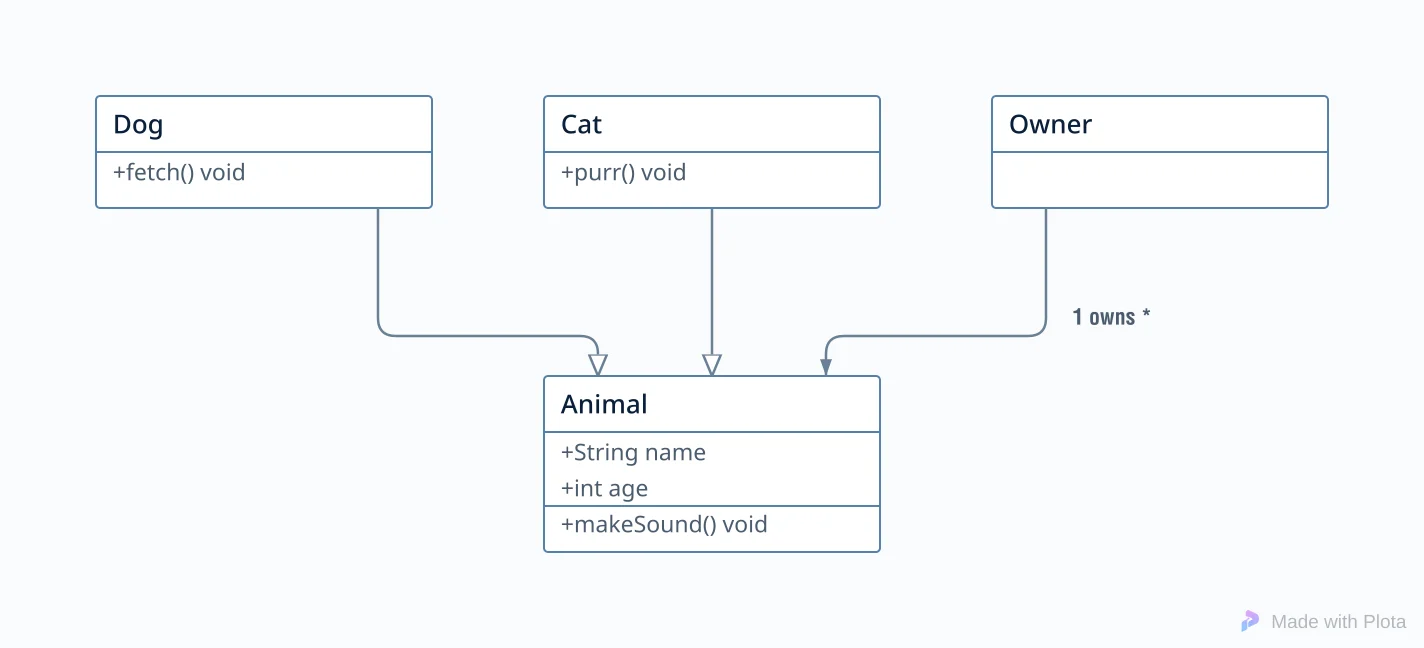
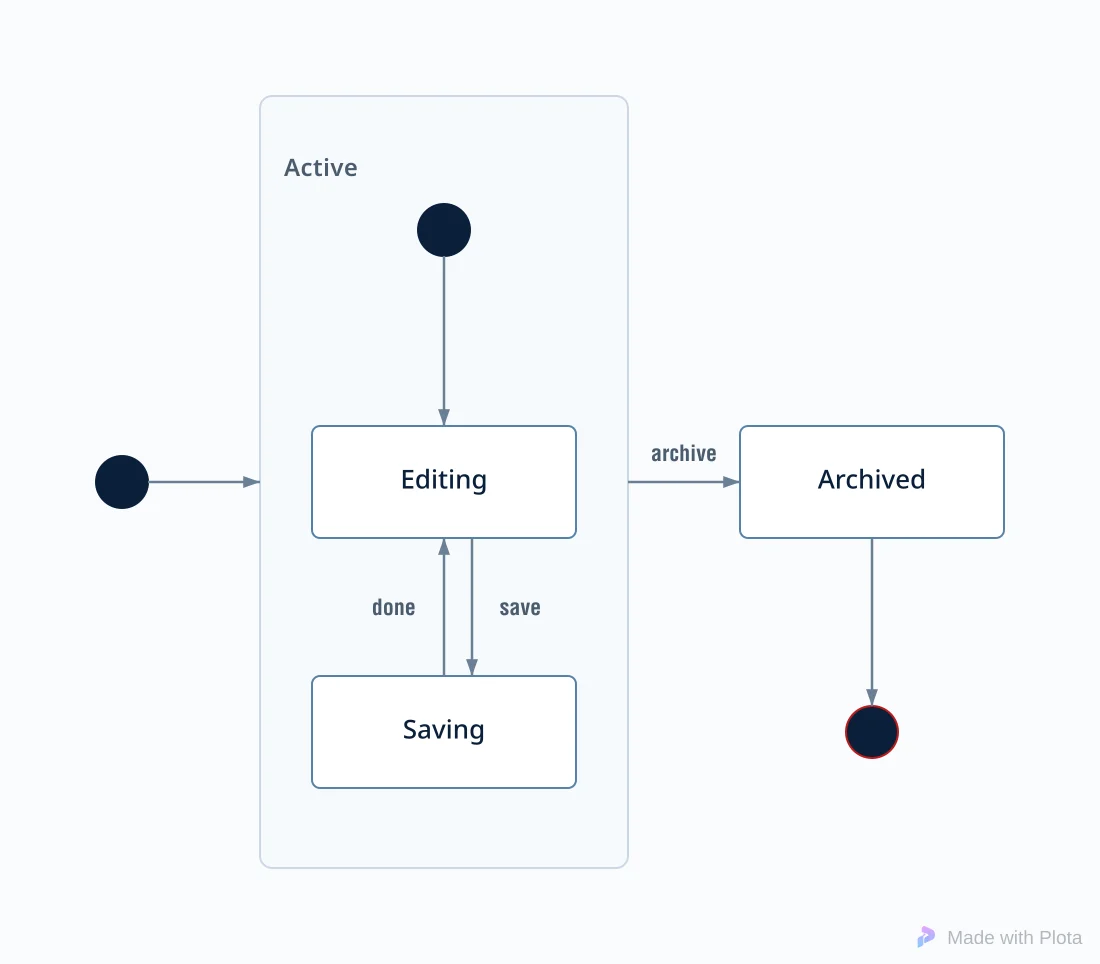
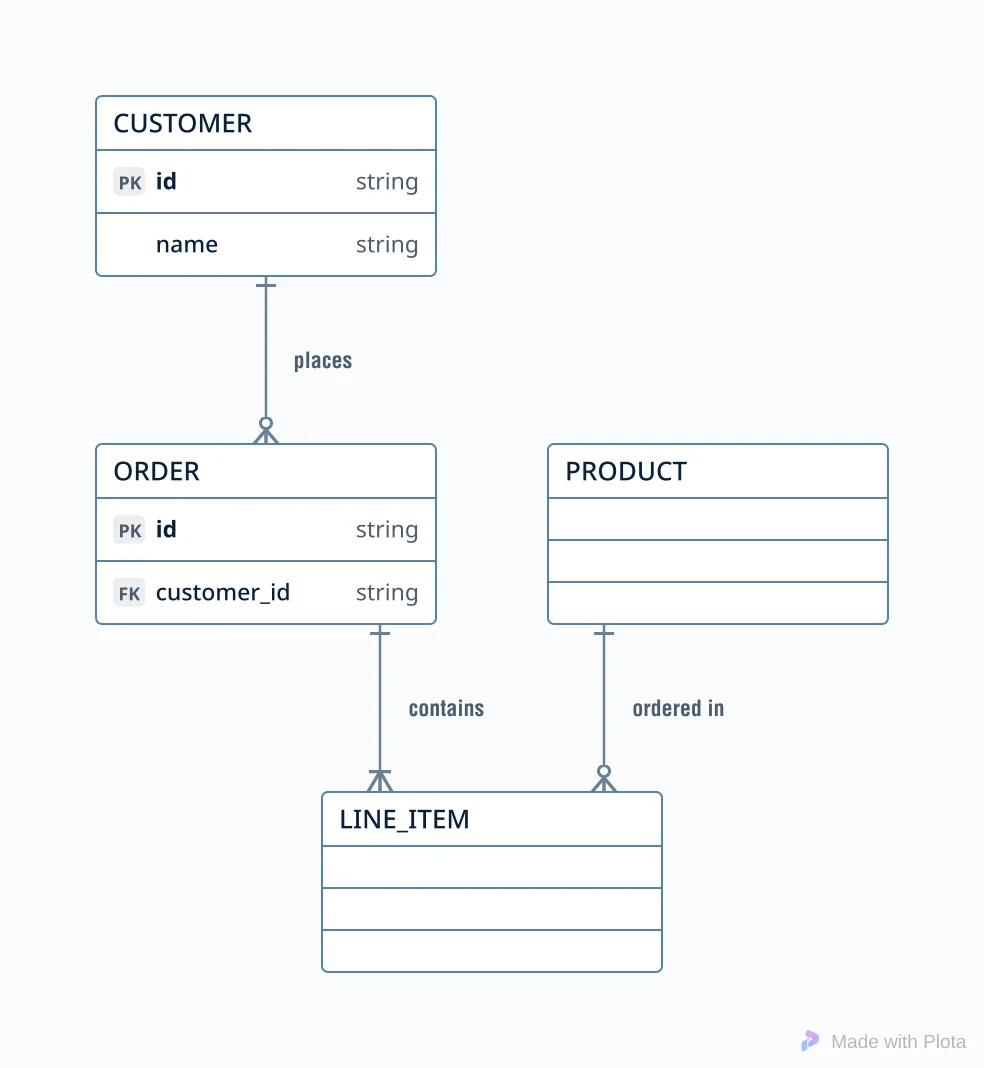
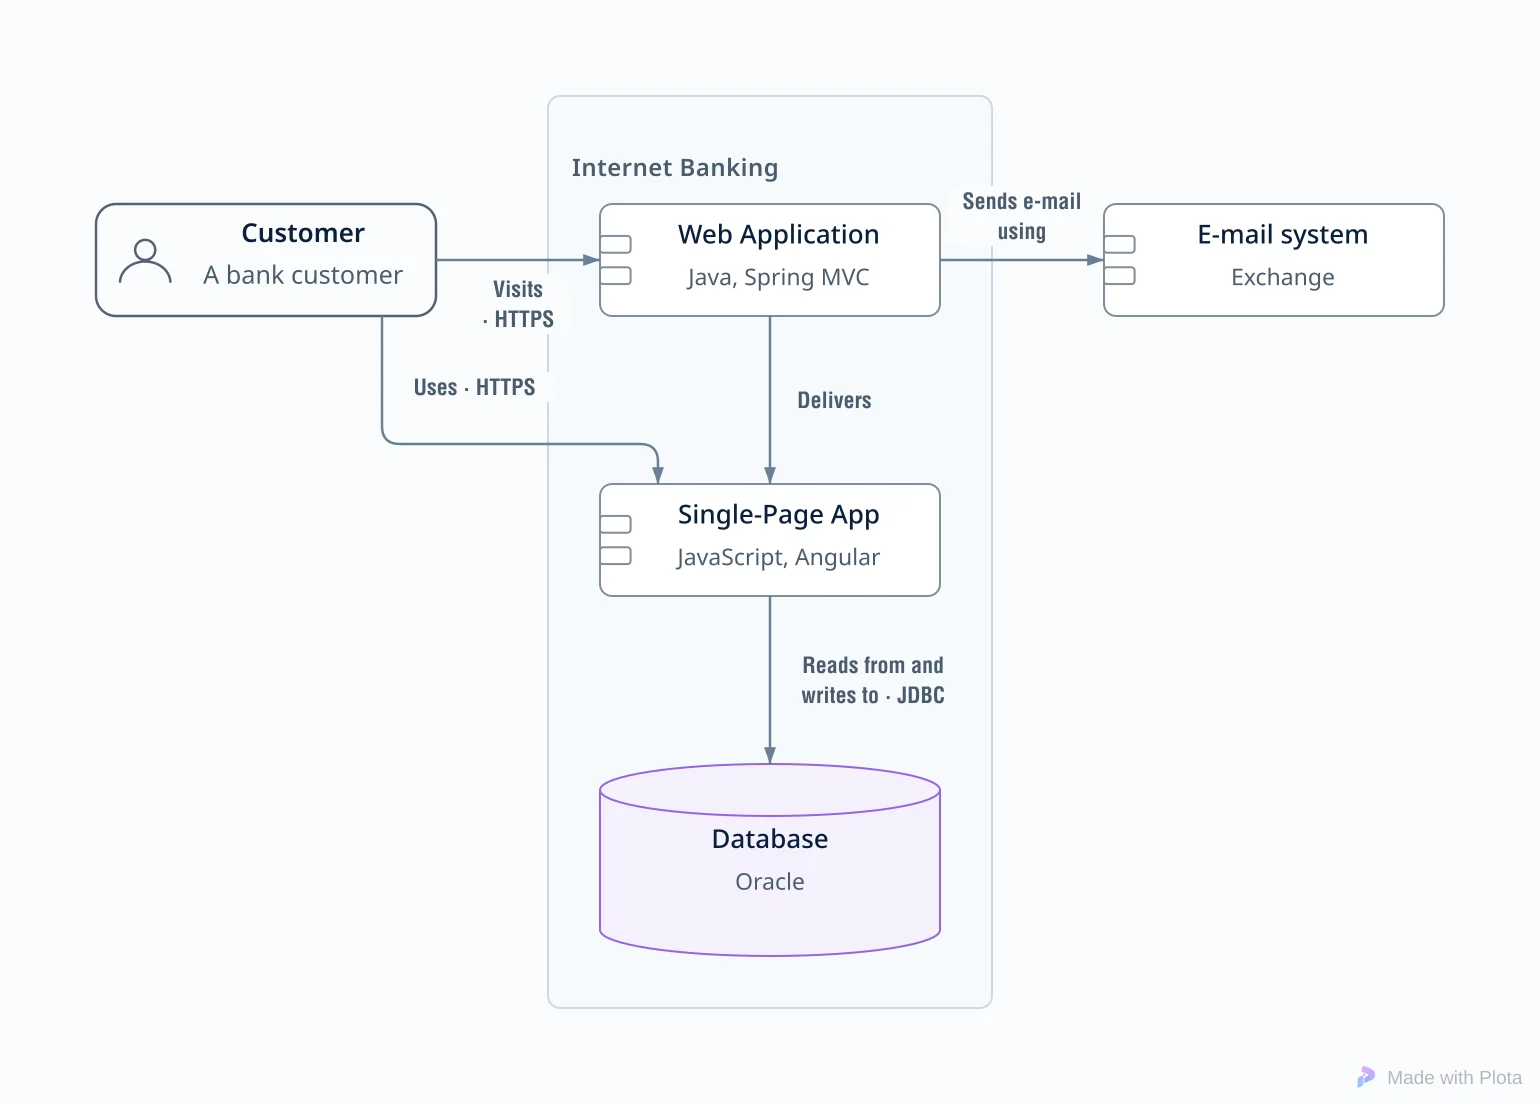
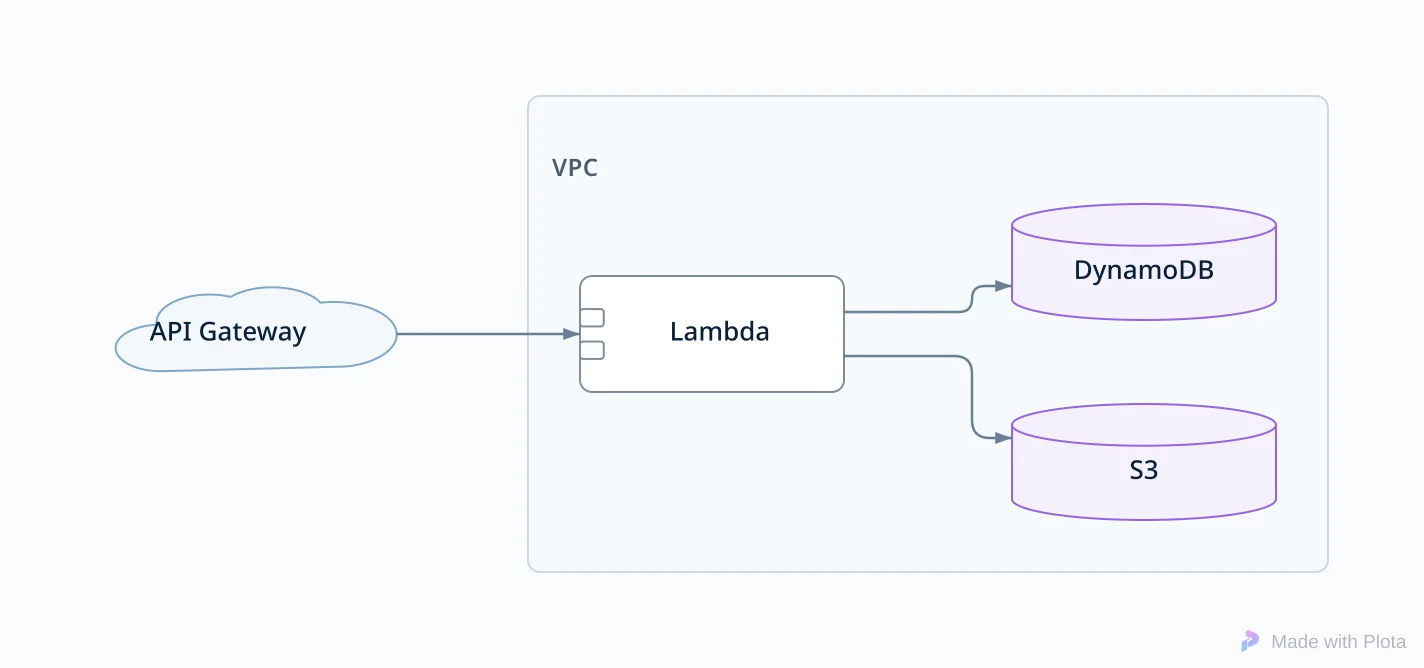
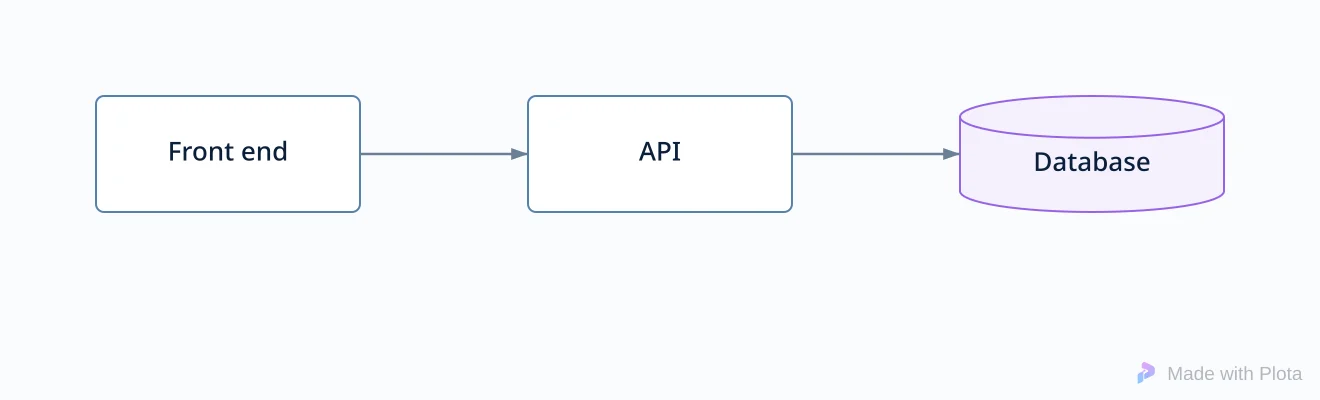
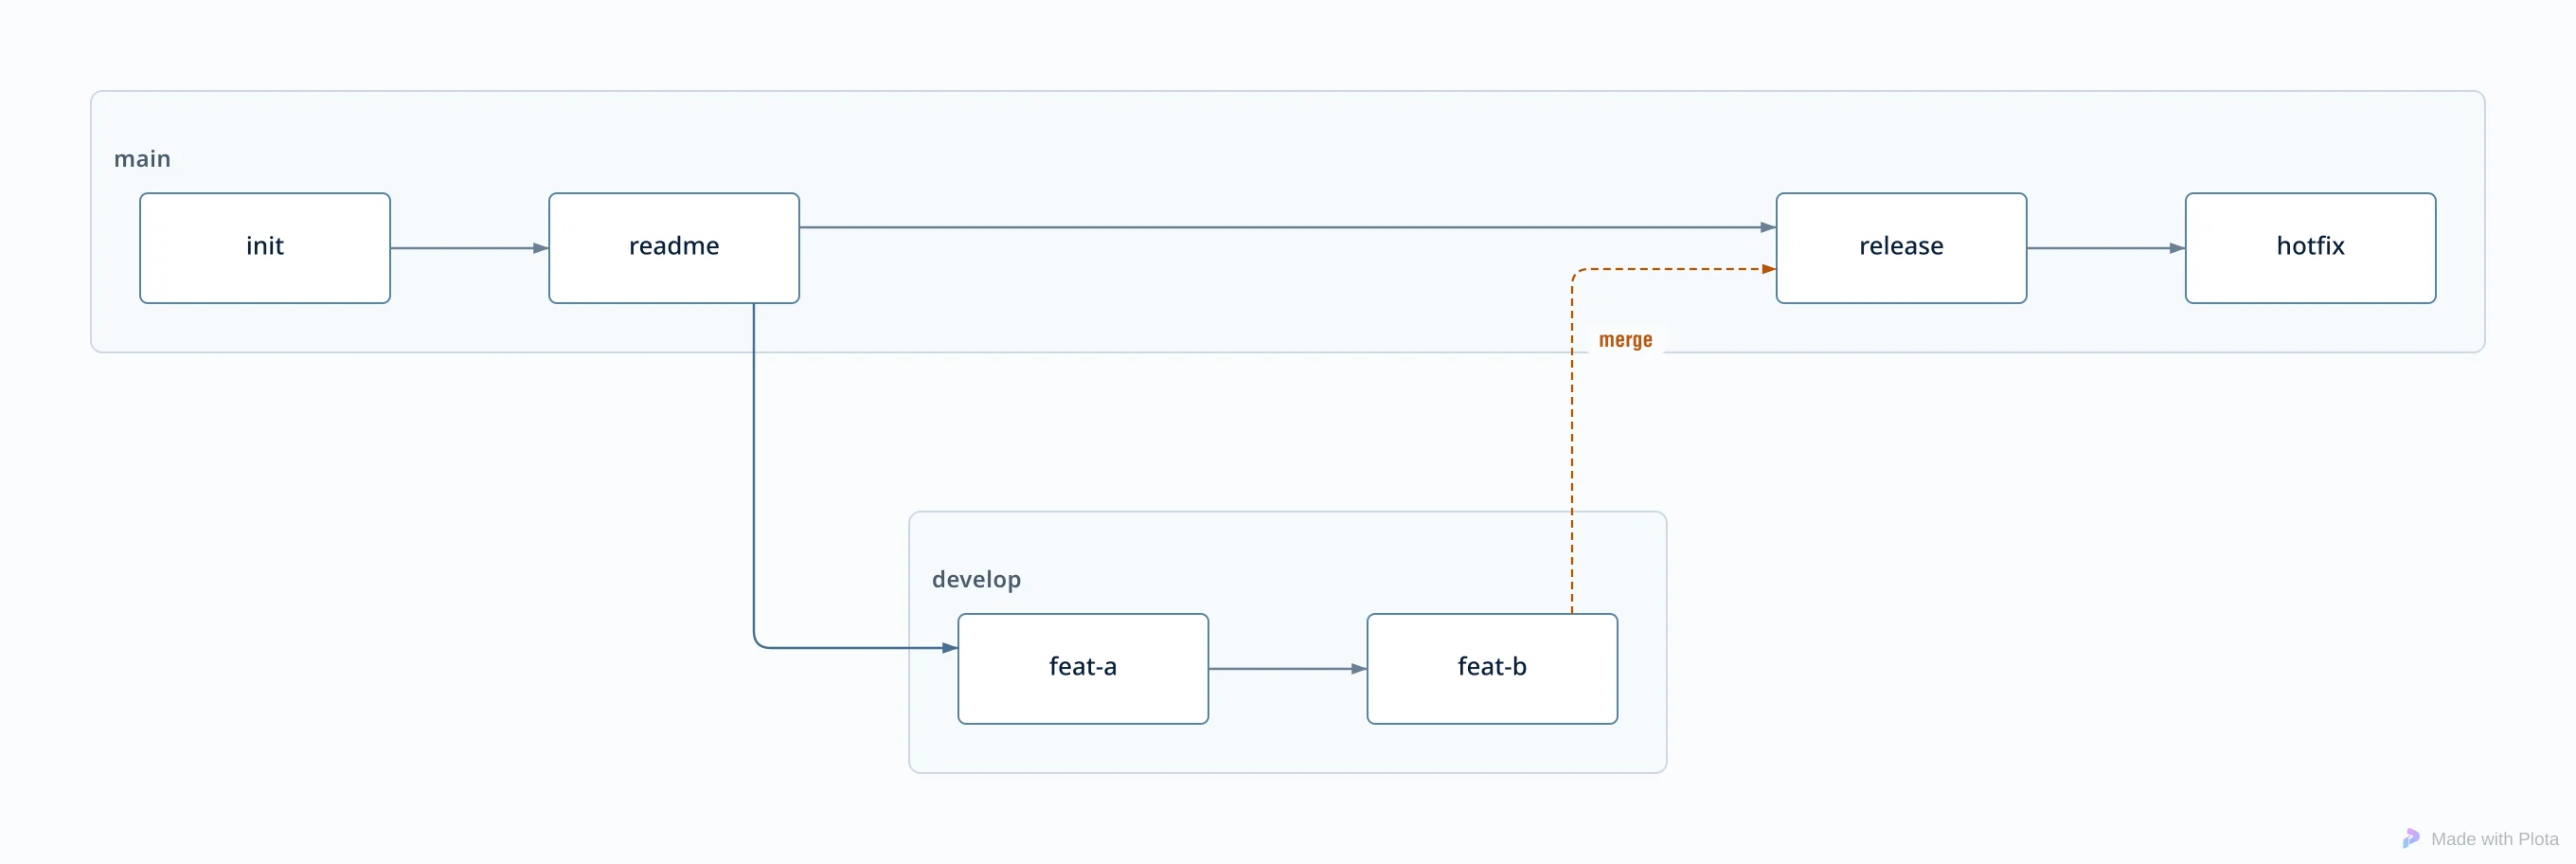
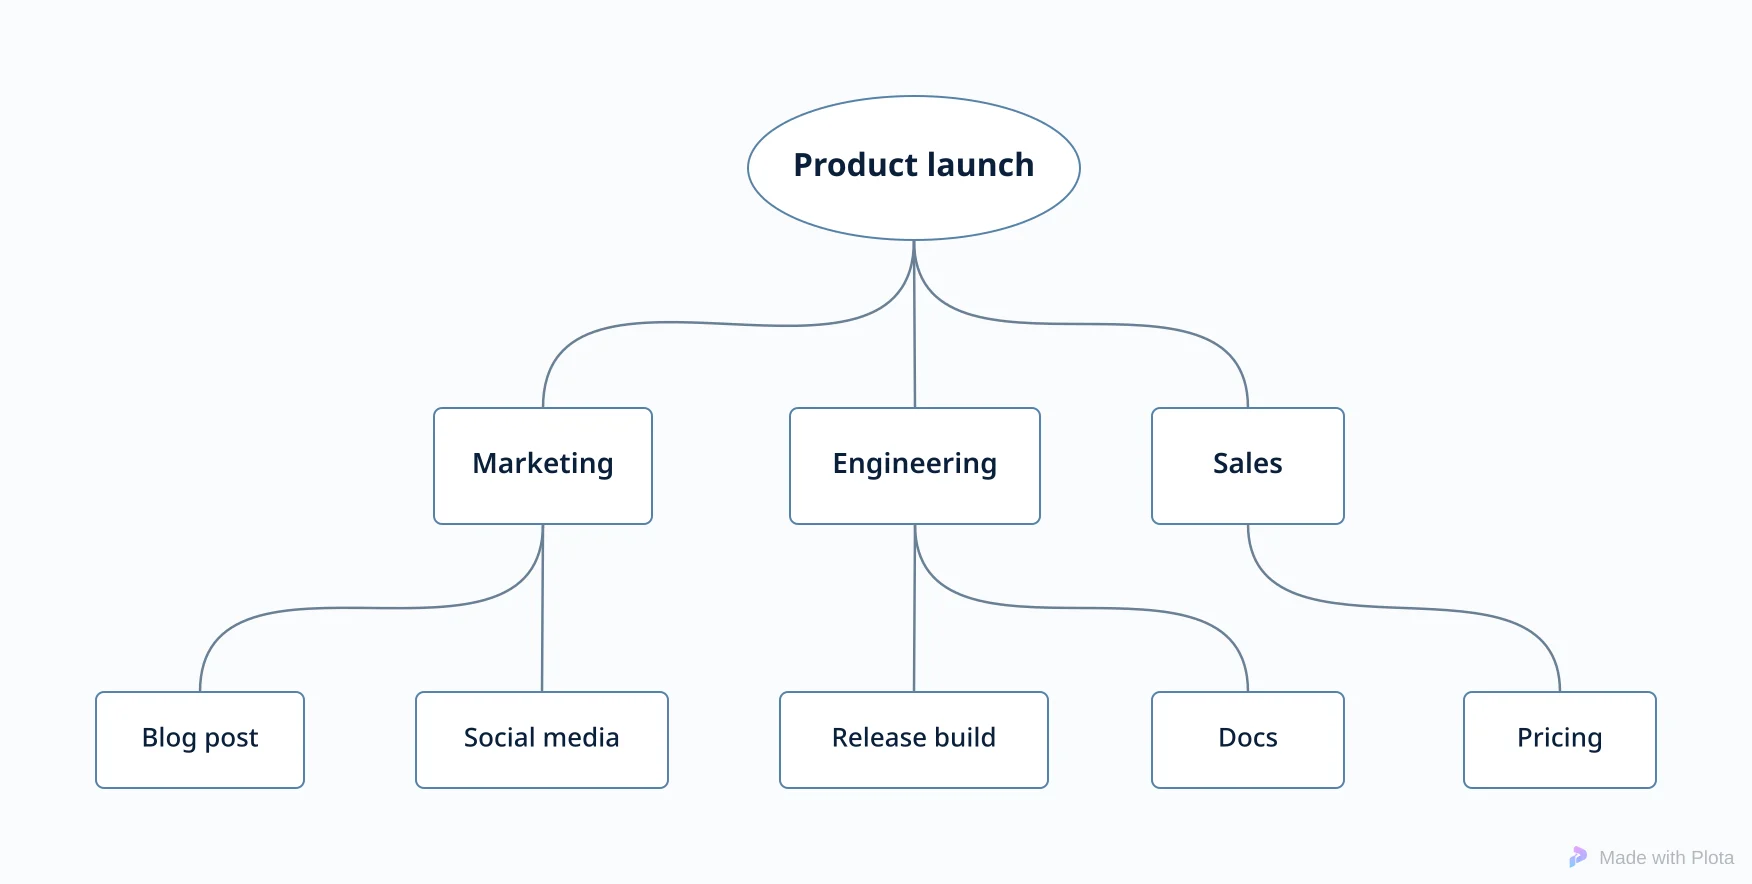
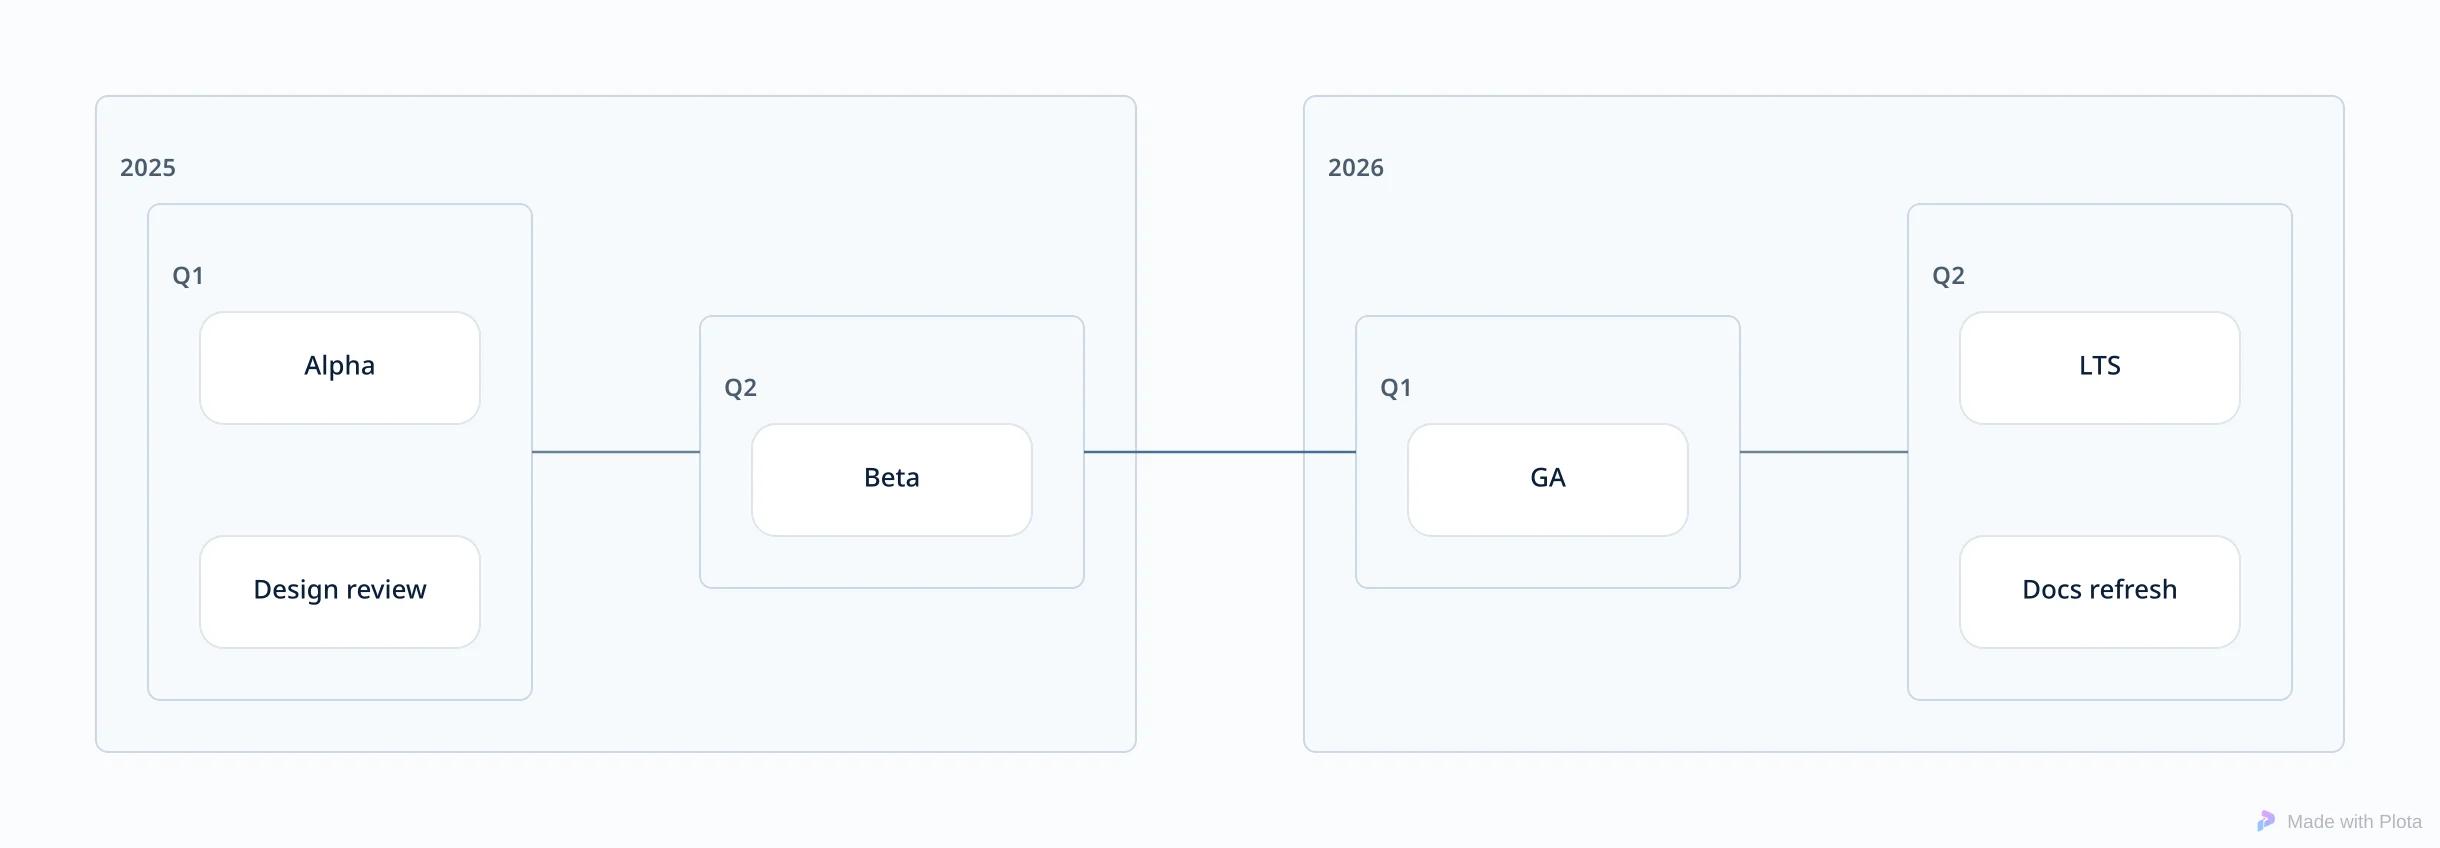
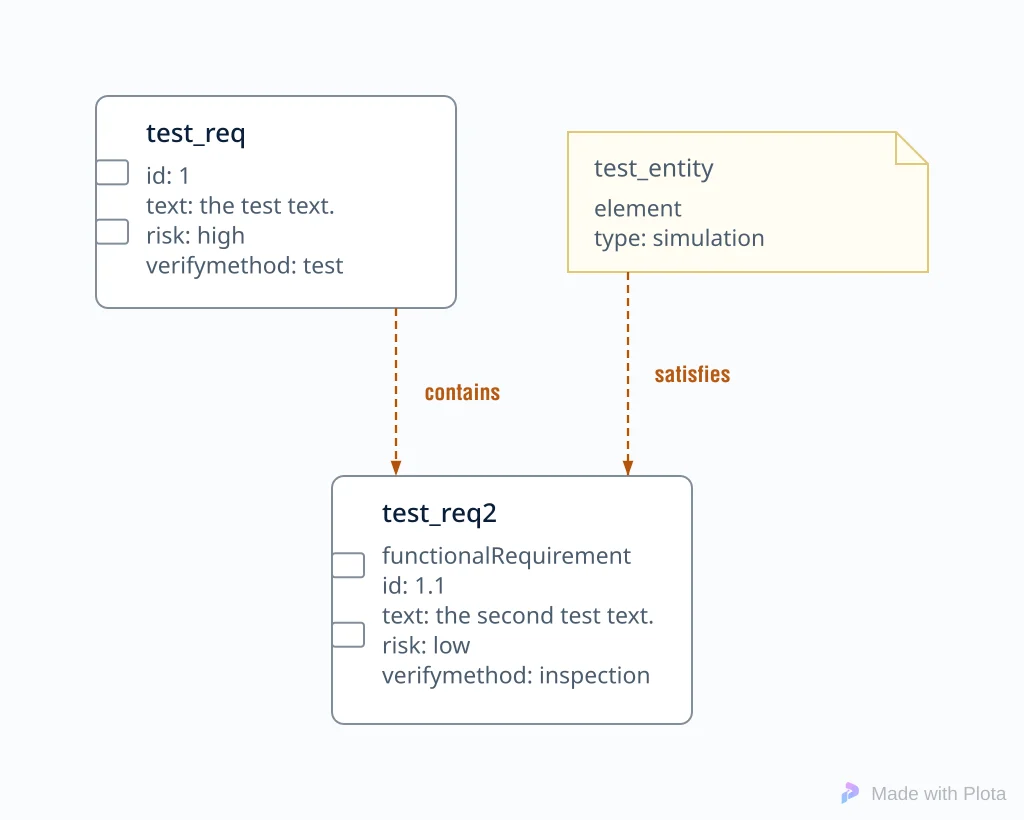
Each picture below is the editor's own export of a small chart of that type
(drawn by the plota CLI, which uses the same exporter — see
the CLI chapter).
| Type | Header | What you get |
|---|---|---|
| Flowchart | flowchart / graph | Every Mermaid node shape, subgraphs as frames, link styles and labels |
| Sequence | sequenceDiagram | Lifelines, messages in rows, activations, notes, alt/opt/loop/par/break frames with their branches, autonumber |
| Class | classDiagram | Classes with their attributes and methods, inheritance, composition, aggregation, multiplicities |
| State | stateDiagram-v2 | States, start and end markers, composite states as frames |
| Entity relationship | erDiagram | Entities with their attributes, crow's-foot ends |
| C4 | C4Context, C4Container, C4Component, C4Dynamic, C4Deployment | People, systems, containers, databases, boundaries |
| Architecture | architecture-beta | Services, groups and junctions |
| Block | block-beta | Blocks in their columns, including the cylinder and other block shapes |
| Git history | gitGraph | Commits in order, one lane per branch, merges |
| Mind map | mindmap (or an indented Markdown outline) | A tree around the root |
| Timeline | timeline | Periods in order, with sections |
| User journey | journey | Sections and steps, with who takes part and the score, coloured by score |
| Requirement | requirementDiagram | Requirements and elements with their relationships |
 |  |
 |  |
 |  |
 |  |
 |  |
 |  |
 |
What is refused, and why#
Some Mermaid types are charts or grids rather than boxes and arrows. Drawing them as shapes would produce something that looks parsed but is not the chart you wrote, so Plota refuses them by name — the message says which type it saw and lists the ones it supports:
gantt, pie, quadrantChart, xychart / xychart-beta, sankey /
sankey-beta, packet / packet-beta, kanban, radar-beta,
treemap-beta and zenuml.
Text with no diagram keyword and no connector syntax is answered with "not Mermaid" rather than a guess.
Large charts: an overview and a page per section#
A flowchart with many sections gets hard to read as one drawing. When you paste or import a flowchart that has two or more subgraphs and is past 80 shapes or 100 connectors, Plota draws it as written and offers, in the status bar, to split it:
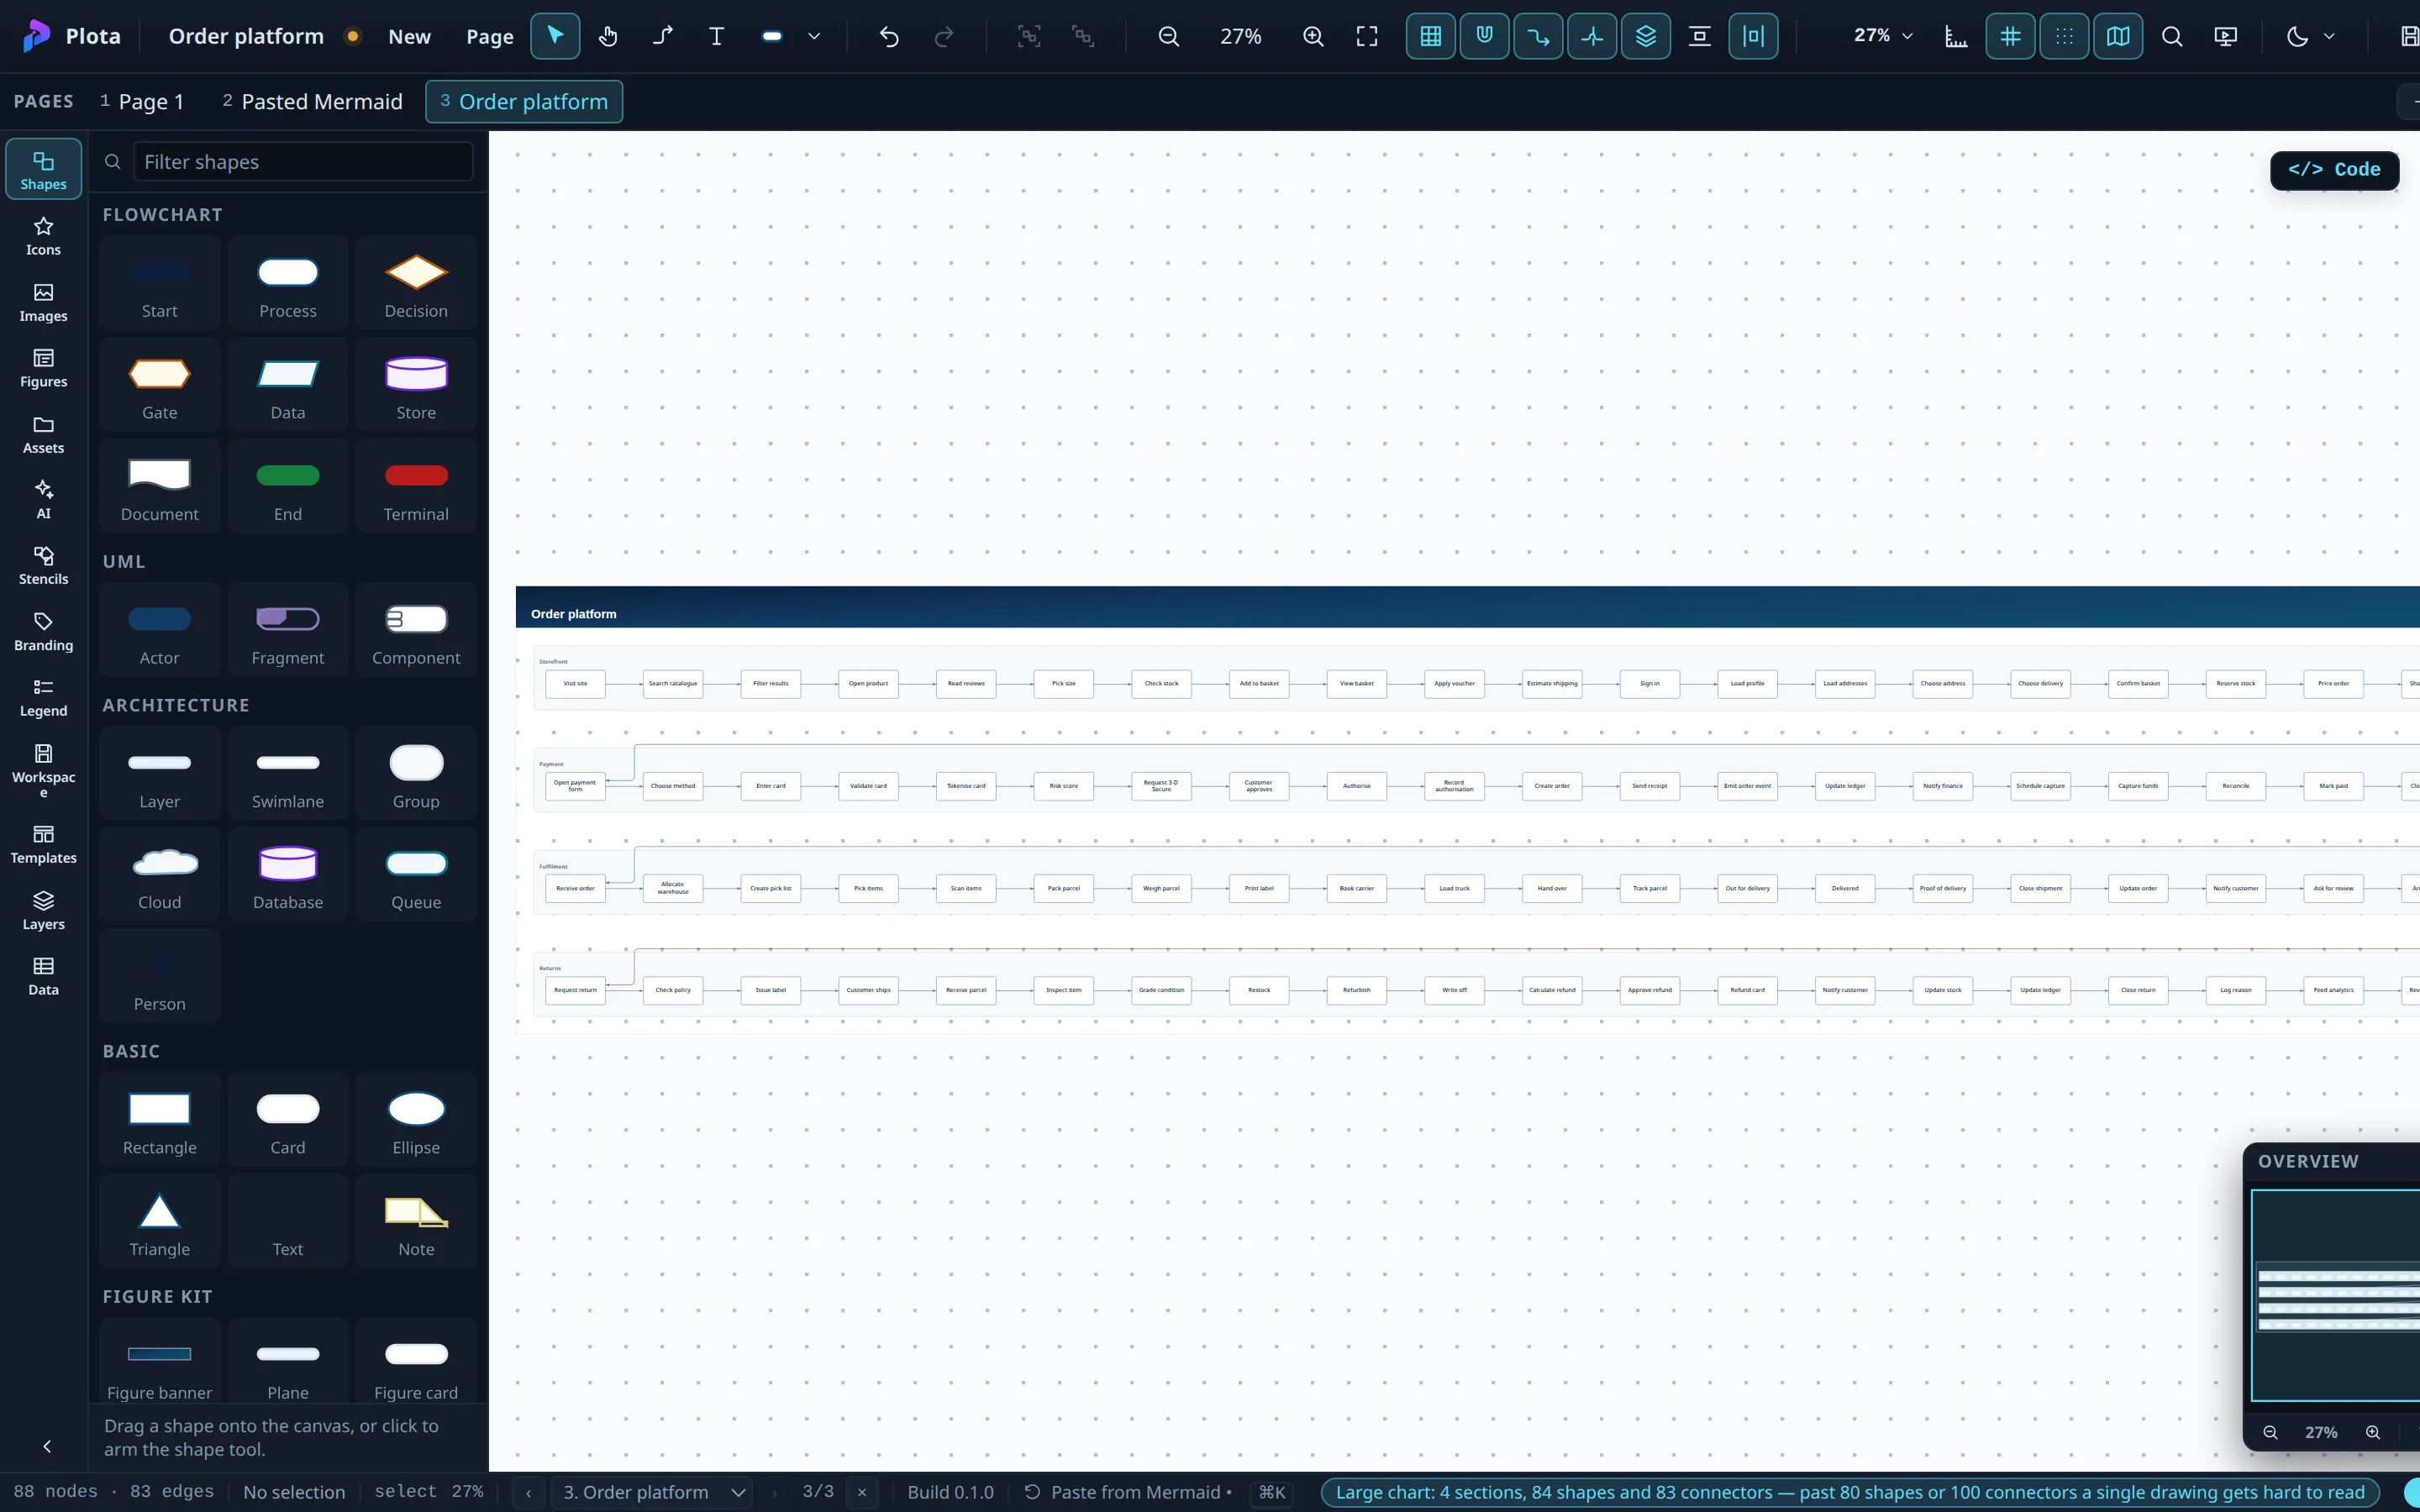
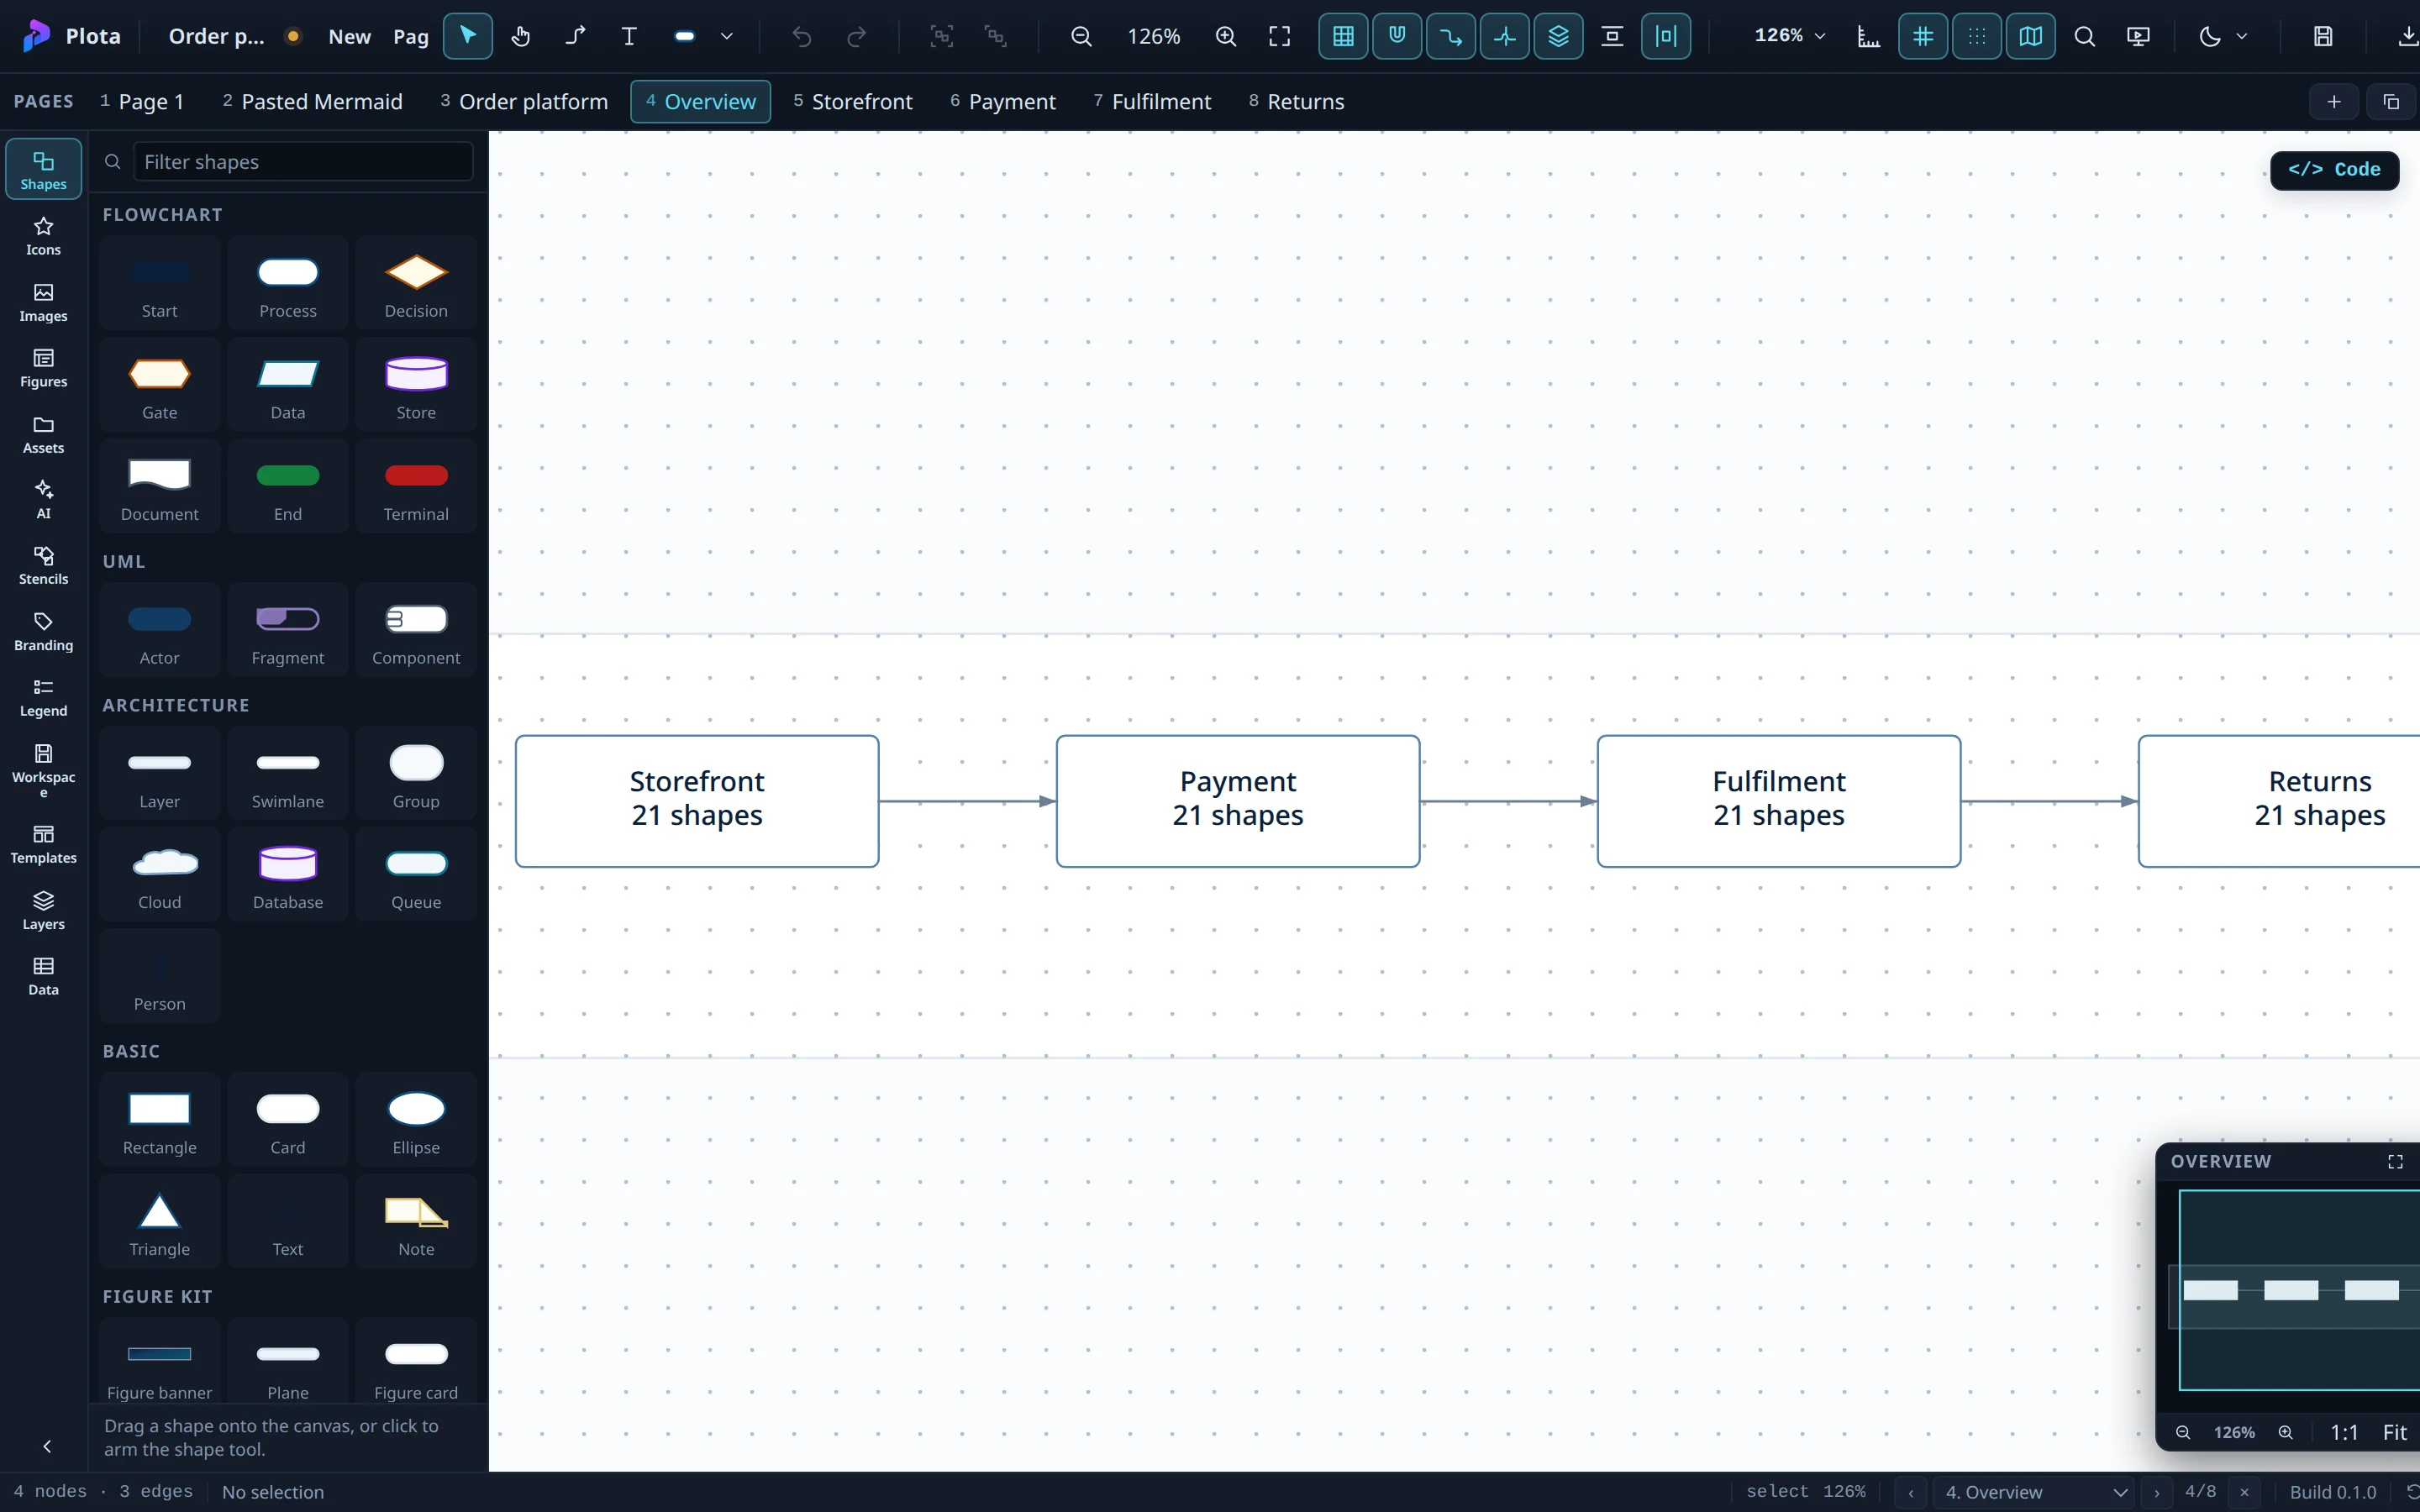
Split into overview + details adds an Overview page — one box per
section, with how many shapes it holds and how the sections connect — and one
page per section. Your original page is kept. Nothing is split until you click,
and the split is one undo step. The same command is in the palette
(Ctrl/⌘ K → "Split into overview + details") for any sectioned chart already
on the canvas, and Go to linked page jumps from an overview box to its page.
The CLI (plota views, or plota render --views) and the MCP server
(import_mermaid_views) produce the same overview and detail pages.
Icons and service tiles#
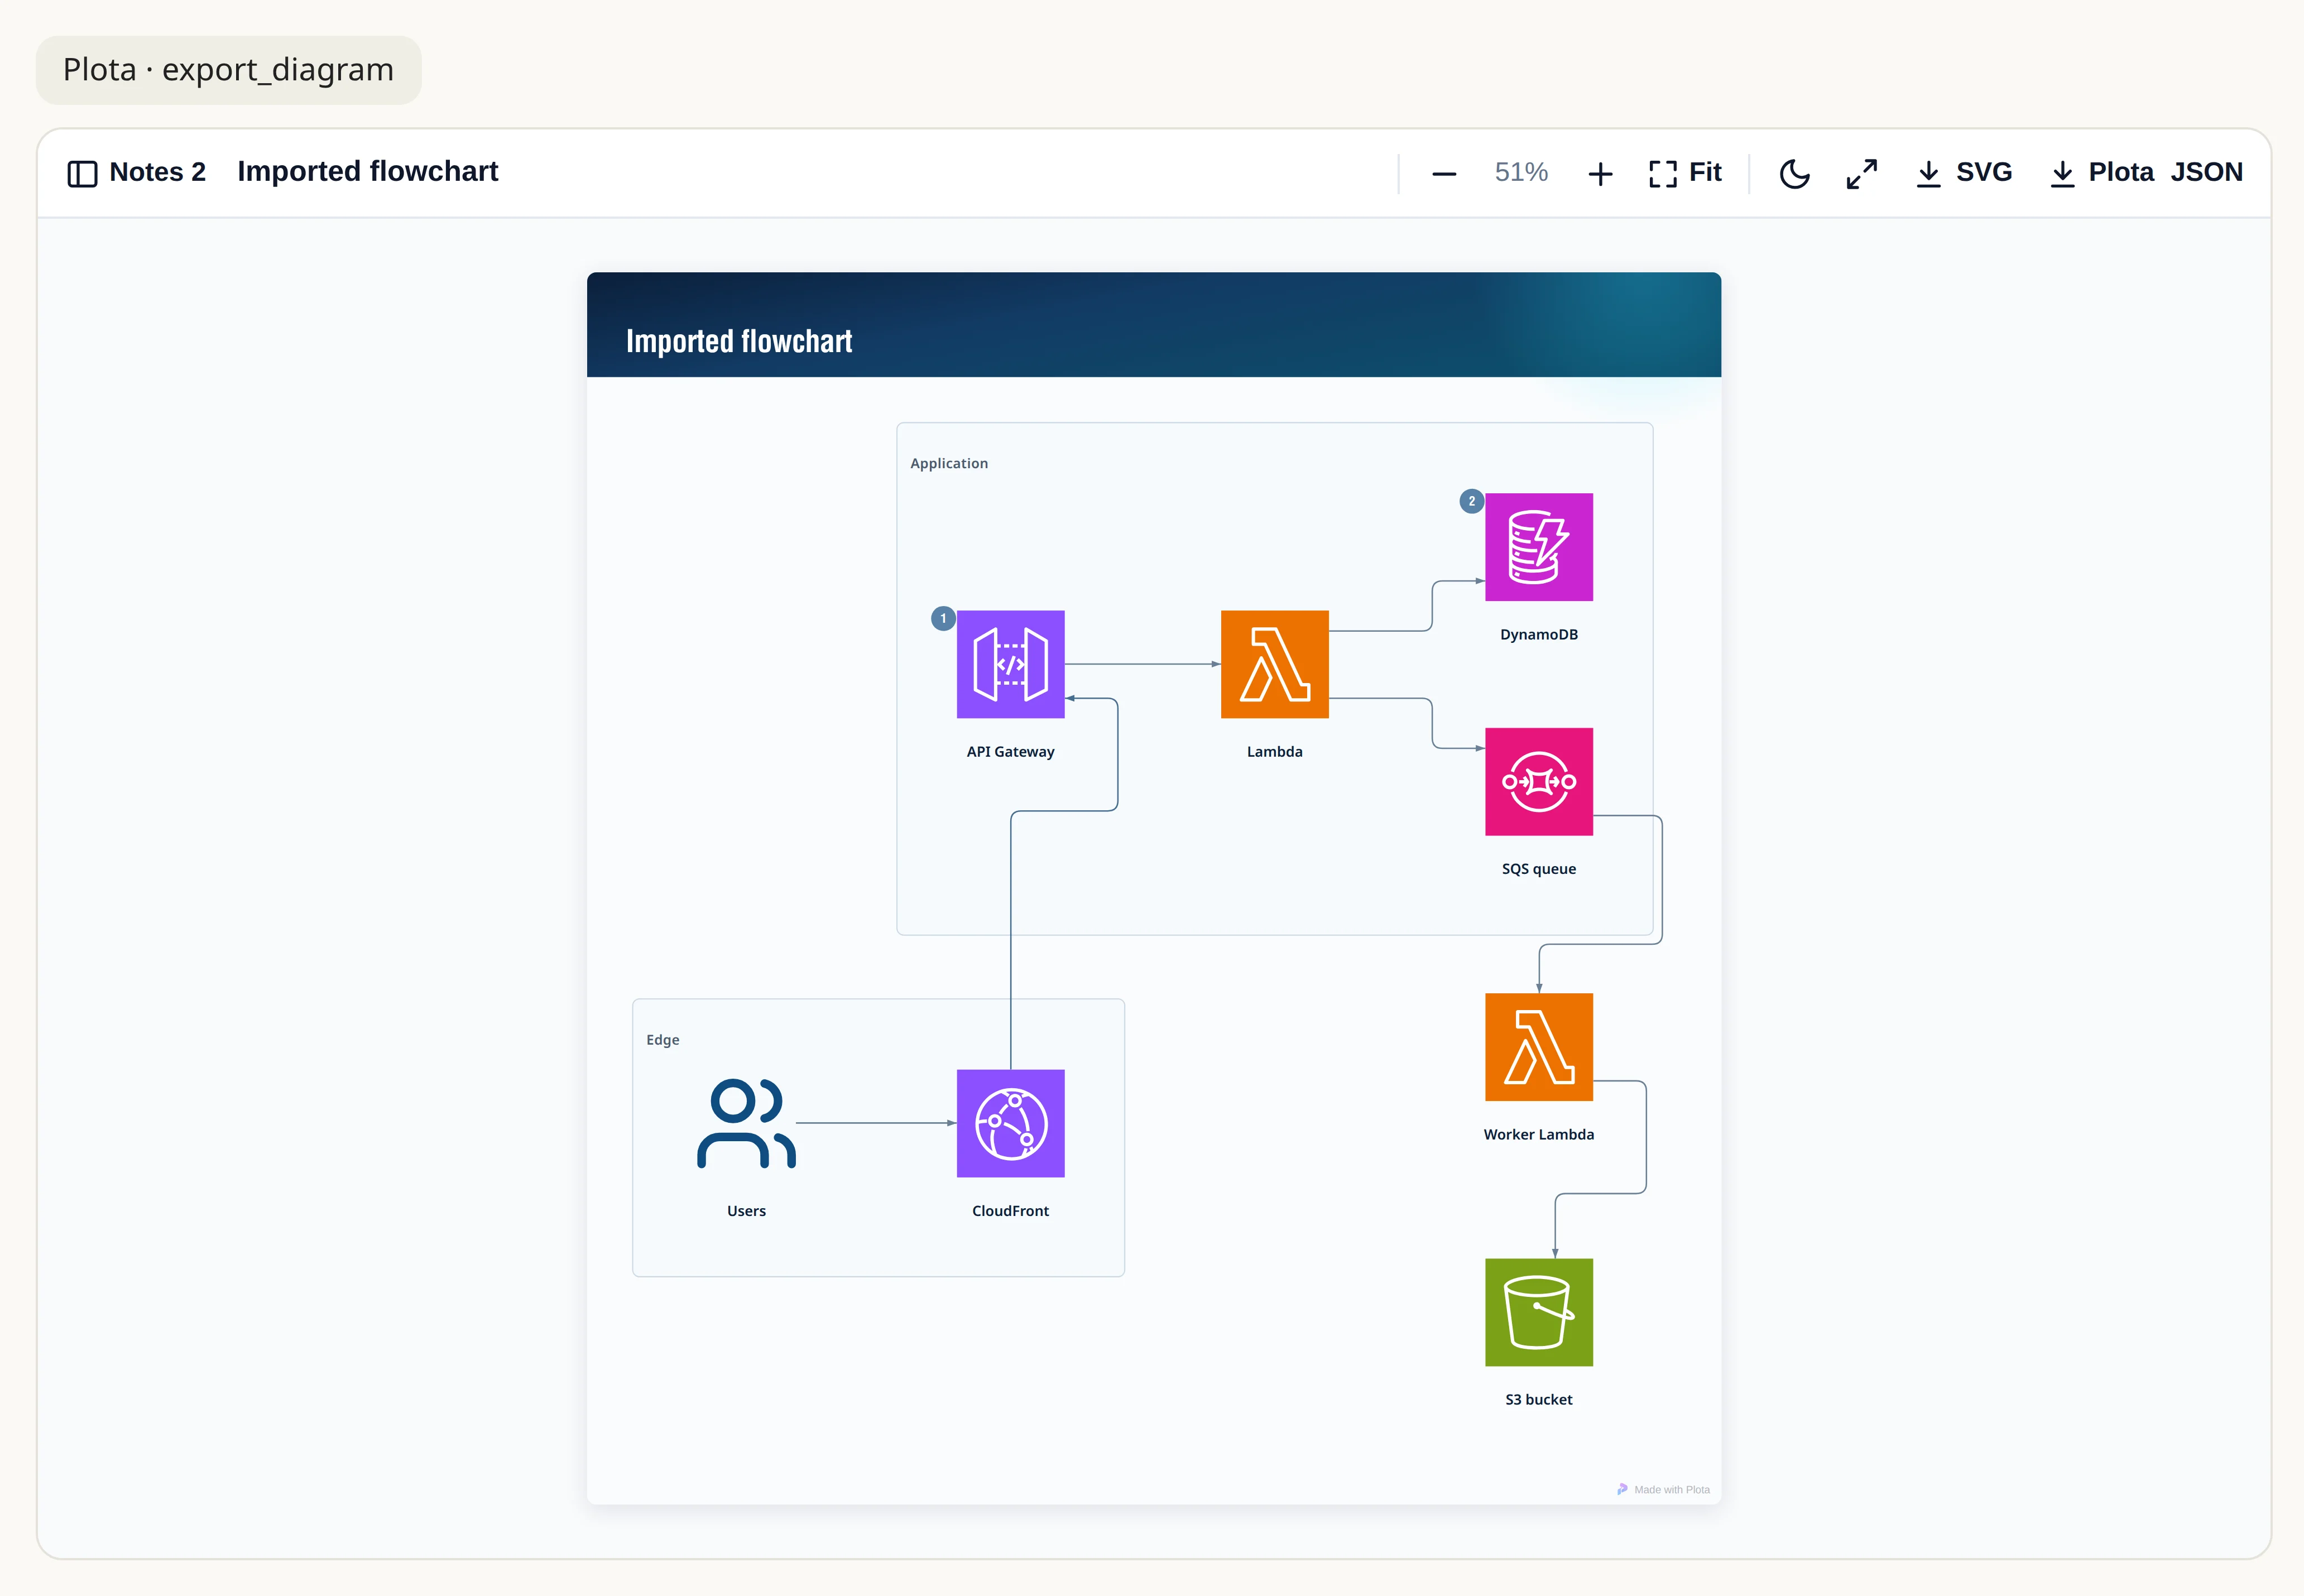
The Icons panel searches the bundled icon catalogue, including AWS, Azure and GCP service marks; drop one on the canvas or onto a shape. The bundled AWS three-tier web app template shows service tiles in use.
When a diagram is built through the MCP server, icons are
applied for you: a node whose caption names a cloud service (CloudFront,
Lambda, DynamoDB, …) becomes that service's tile, and a caption naming another
product or technology gets its icon beside the label. Mermaid's own
id@{ icon: "aws:lambda" } syntax is honoured there too. Pass icons: false
to turn this off. Pasting Mermaid into the editor keeps plain shapes.
Notes#
A long note does not belong inside a box. Sequence, class and state notes are
drawn where Mermaid puts them, and flowchart comments such as
%% cost db [$1.2k/mo]: Aurora Multi-AZ become numbered notes with a badge.
Through the MCP server, give a node a note (or a list of notes) and it is
shown as a numbered marker on the shape with the full text in the notes panel;
the viewer lists every note on the page. See
Notes and badges.